Is It Too Late To Consider Hamilton Insurance Group (HG) After A 57% One Year Rally?
Hamilton Insurance Group, Ltd. Class B HG | 0.00 |
- Wondering if Hamilton Insurance Group is still good value after its recent run, or if you might be late to the party? This article walks through what the numbers actually say about the stock.
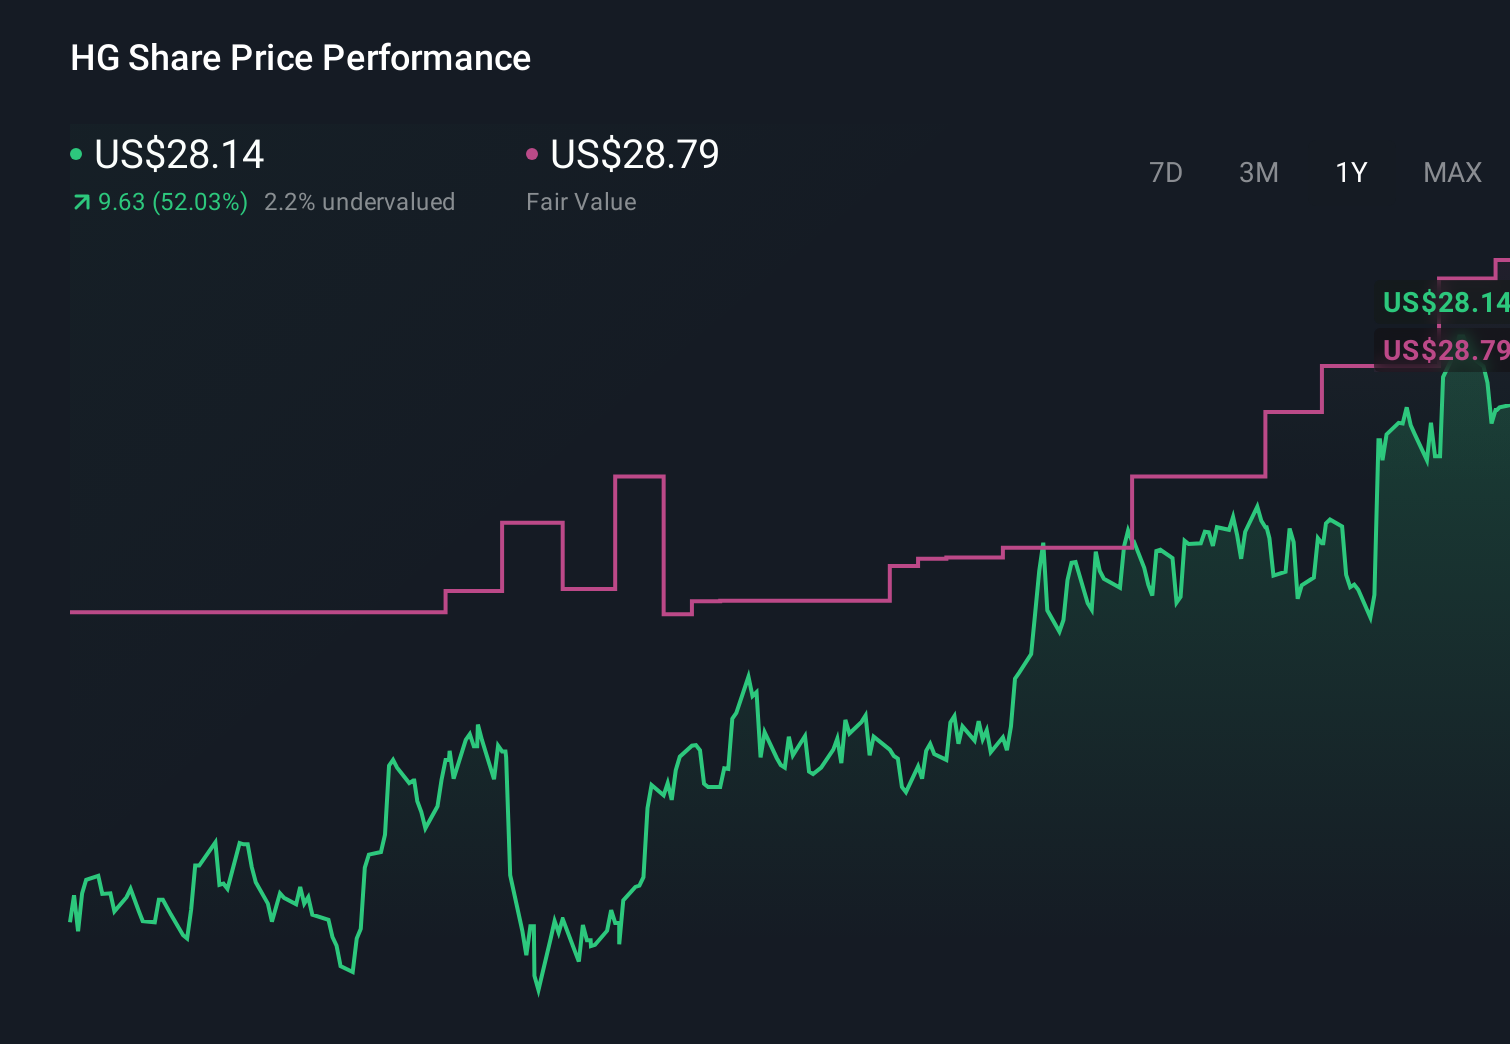
- The share price recently closed at US$29.48, with returns of 6.0% over the last 7 days, 12.5% over the last 30 days and 56.9% over the last year. This naturally raises questions about how much upside or risk is now priced in.
- Recent coverage has focused on Hamilton Insurance Group as a publicly listed specialty insurer and reinsurer, highlighting its position in the broader insurance market and how investors are treating that exposure. This context helps explain why the stock has attracted more attention as its price and trading activity have shifted.
- On our simple 6 point undervaluation checklist, Hamilton Insurance Group currently scores 5 out of 6. Next, we will look at how different valuation tools line up on the stock before touching on an even more complete way to think about value at the end of the article.
Approach 1: Hamilton Insurance Group Excess Returns Analysis
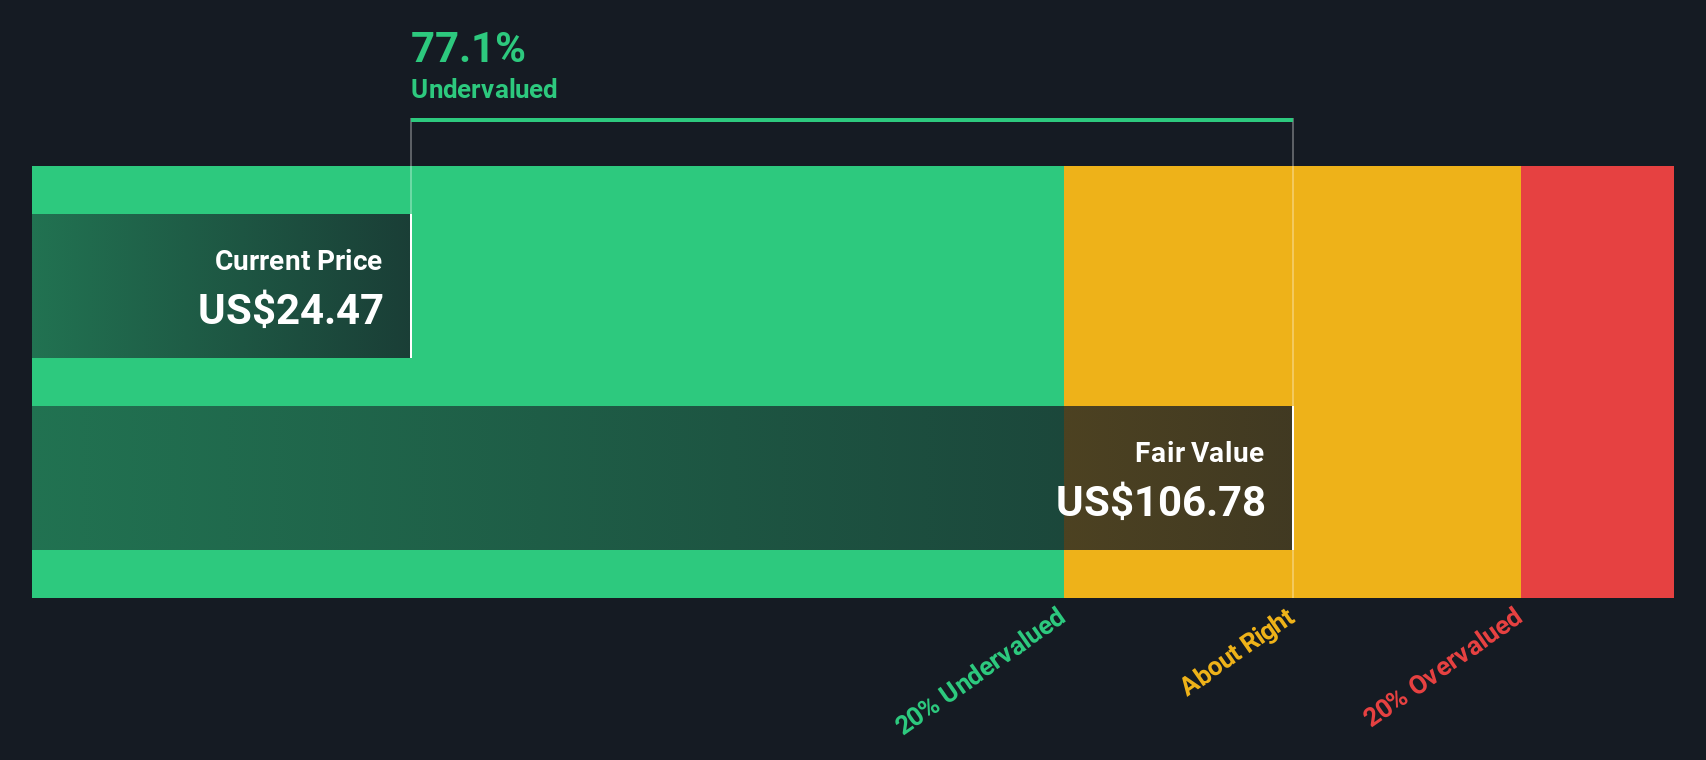
The Excess Returns model looks at how much profit a company can generate over and above its cost of equity, then capitalizes those “extra” profits into an intrinsic value per share.
For Hamilton Insurance Group, the model starts with a Book Value of US$27.06 per share and a Stable EPS of US$7.86 per share, based on the median return on equity from the past 5 years. The implied Cost of Equity is US$2.46 per share, which leaves an Excess Return of US$5.40 per share.
The company’s Average Return on Equity of 22.31% is applied to a Stable Book Value estimate of US$35.21 per share, built from weighted future book value estimates from 3 analysts. The model then discounts these excess returns back to today to arrive at an intrinsic value of about US$186.51 per share.
Compared with the recent share price of US$29.48, this Excess Returns valuation implies the stock is 84.2% undervalued on this measure.
Result: UNDERVALUED
Our Excess Returns analysis suggests Hamilton Insurance Group is undervalued by 84.2%. Track this in your watchlist or portfolio, or discover 52 more high quality undervalued stocks.
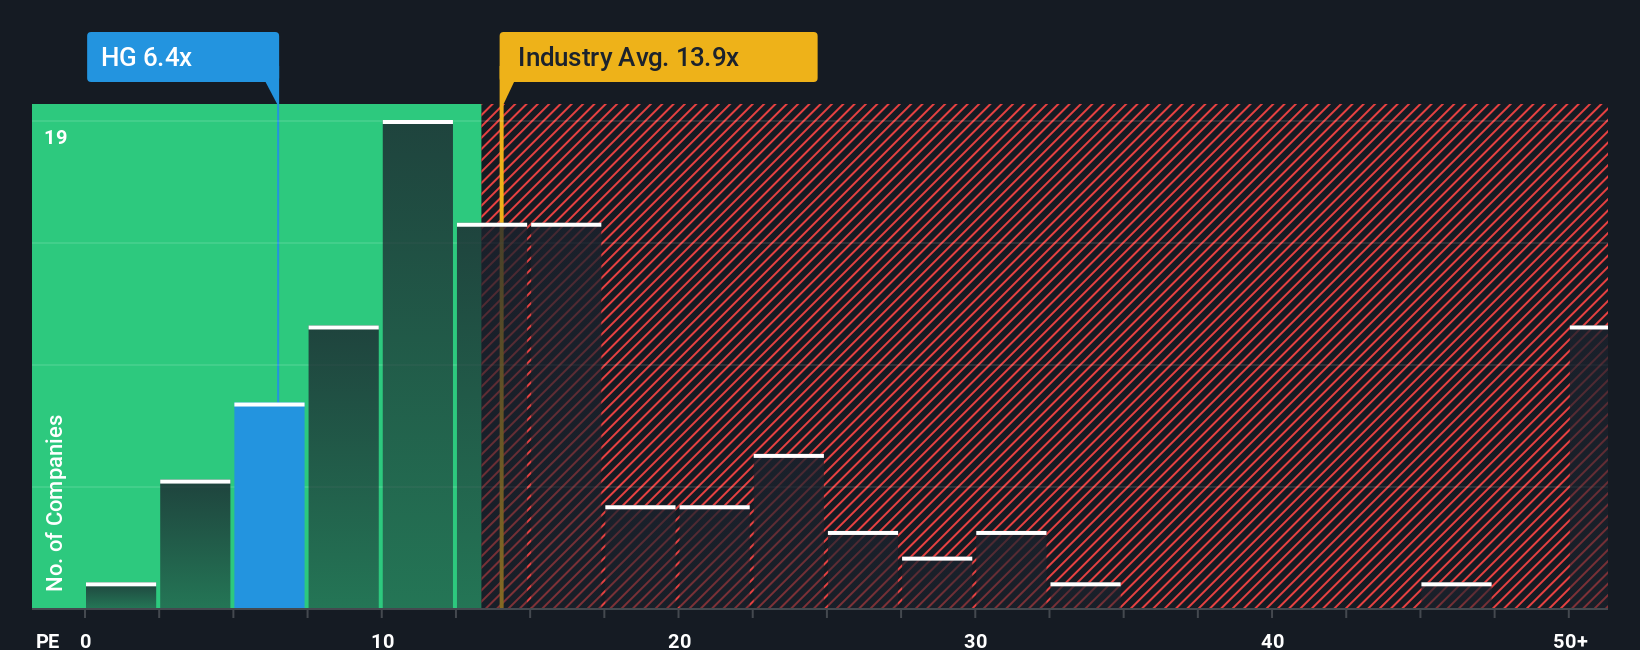
Approach 2: Hamilton Insurance Group Price vs Earnings
For a profitable insurer like Hamilton Insurance Group, the P/E ratio is a useful way to relate what you are paying for each share to the company’s current earnings. Investors usually accept a higher P/E when they expect stronger earnings growth or see lower risk in the business, while slower growth or higher risk tends to justify a lower “normal” P/E.
Hamilton Insurance Group currently trades on a P/E of 6.61x. That sits below the Insurance industry average P/E of 12.58x and also below the peer group average of 12.28x, so the stock is priced at a discount to both broad sector and closer comparables on this simple measure.
Simply Wall St’s Fair Ratio for Hamilton Insurance Group is 11.94x. This is a proprietary estimate of what the P/E might be given the company’s earnings profile, industry, profit margins, market cap and risk characteristics. Because it builds these factors into a single number, the Fair Ratio can give you a more tailored anchor than a basic peer or industry comparison, which may mix companies with very different growth and risk profiles. Comparing 6.61x to the 11.94x Fair Ratio suggests the shares trade below this modelled “fair” level.
Result: UNDERVALUED
P/E ratios tell one story, but what if the real opportunity lies elsewhere? Start investing in legacies, not executives. Discover our 22 top founder-led companies.
Upgrade Your Decision Making: Choose your Hamilton Insurance Group Narrative
Earlier we mentioned that there is an even better way to think about value, and that is through Narratives. You can tell your own Hamilton Insurance Group story by tying your assumptions for future revenue, earnings, margins and fair value to a simple forecast, then compare that fair value to today’s price inside the Narratives tool on Simply Wall St’s Community page. You can see it update automatically when new results or news arrive, and weigh different viewpoints. For example, one investor might see Hamilton as a fairly valued US$30.07 opportunity built on 5.2% revenue growth, a 16.25% profit margin and a 6.31x future P/E, while another might use the same information to support a more cautious stance around US$23. This allows you to decide which story you believe most.
Do you think there's more to the story for Hamilton Insurance Group? Head over to our Community to see what others are saying!
This article by Simply Wall St is general in nature. We provide commentary based on historical data and analyst forecasts only using an unbiased methodology and our articles are not intended to be financial advice. It does not constitute a recommendation to buy or sell any stock, and does not take account of your objectives, or your financial situation. We aim to bring you long-term focused analysis driven by fundamental data. Note that our analysis may not factor in the latest price-sensitive company announcements or qualitative material. Simply Wall St has no position in any stocks mentioned.