Is It Too Late To Consider Interactive Brokers Group (IBKR) After A 4x Multi Year Run
Interactive Brokers Group, Inc. Class A IBKR | 68.11 | -0.74% |
- If you are wondering whether Interactive Brokers Group is still good value after a strong run, you are not alone. This article focuses squarely on what the current price might be offering you.
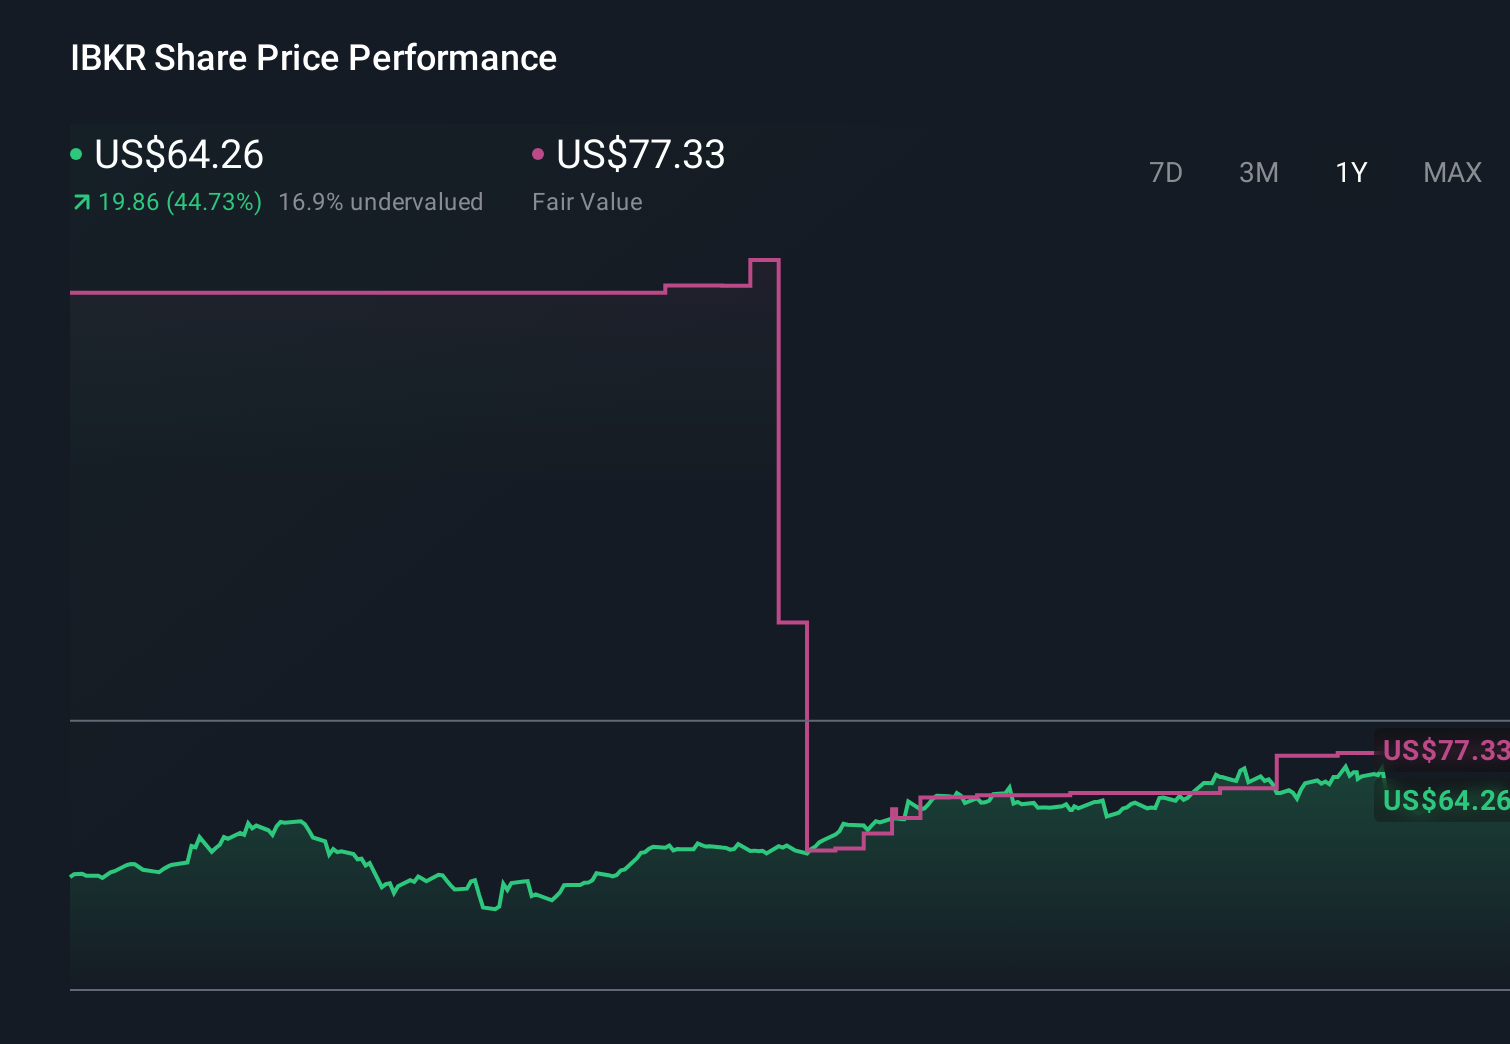
- The stock last closed at US$75.35, with returns of 2.7% over 7 days, 13.9% over 30 days, 12.1% year to date, 48.6% over 1 year and a very large gain over 3 and 5 years that is close to 4x.
- Recent coverage has highlighted Interactive Brokers Group as a long term compounder in the online brokerage space and has pointed to its multi year share price gains as a reference point for investor interest. Other commentary has focused on how its global trading platform and broad product offering keep it in the conversation when investors look at listed brokers.
- Despite this share price history, Interactive Brokers Group currently scores 0 out of 6 on our valuation checks, giving it a valuation score of 0. Next we will walk through how different valuation approaches view the stock before finishing with a more complete way to think about valuation overall.
Interactive Brokers Group scores just 0/6 on our valuation checks. See what other red flags we found in the full valuation breakdown.
Approach 1: Interactive Brokers Group Excess Returns Analysis
The Excess Returns model looks at how much profit a company is expected to earn above the return that shareholders require, then adds that stream of excess profit to the current value of its equity base.
For Interactive Brokers Group, the model starts with a Book Value of $12.04 per share and a Stable Book Value estimate of $14.78 per share, based on future book value estimates from 2 analysts. It uses a Stable EPS of $2.52 per share, sourced from weighted future return on equity estimates from 4 analysts, and a Cost of Equity of $1.26 per share. That produces an Excess Return of $1.26 per share, with an Average Return on Equity of 17.04%.
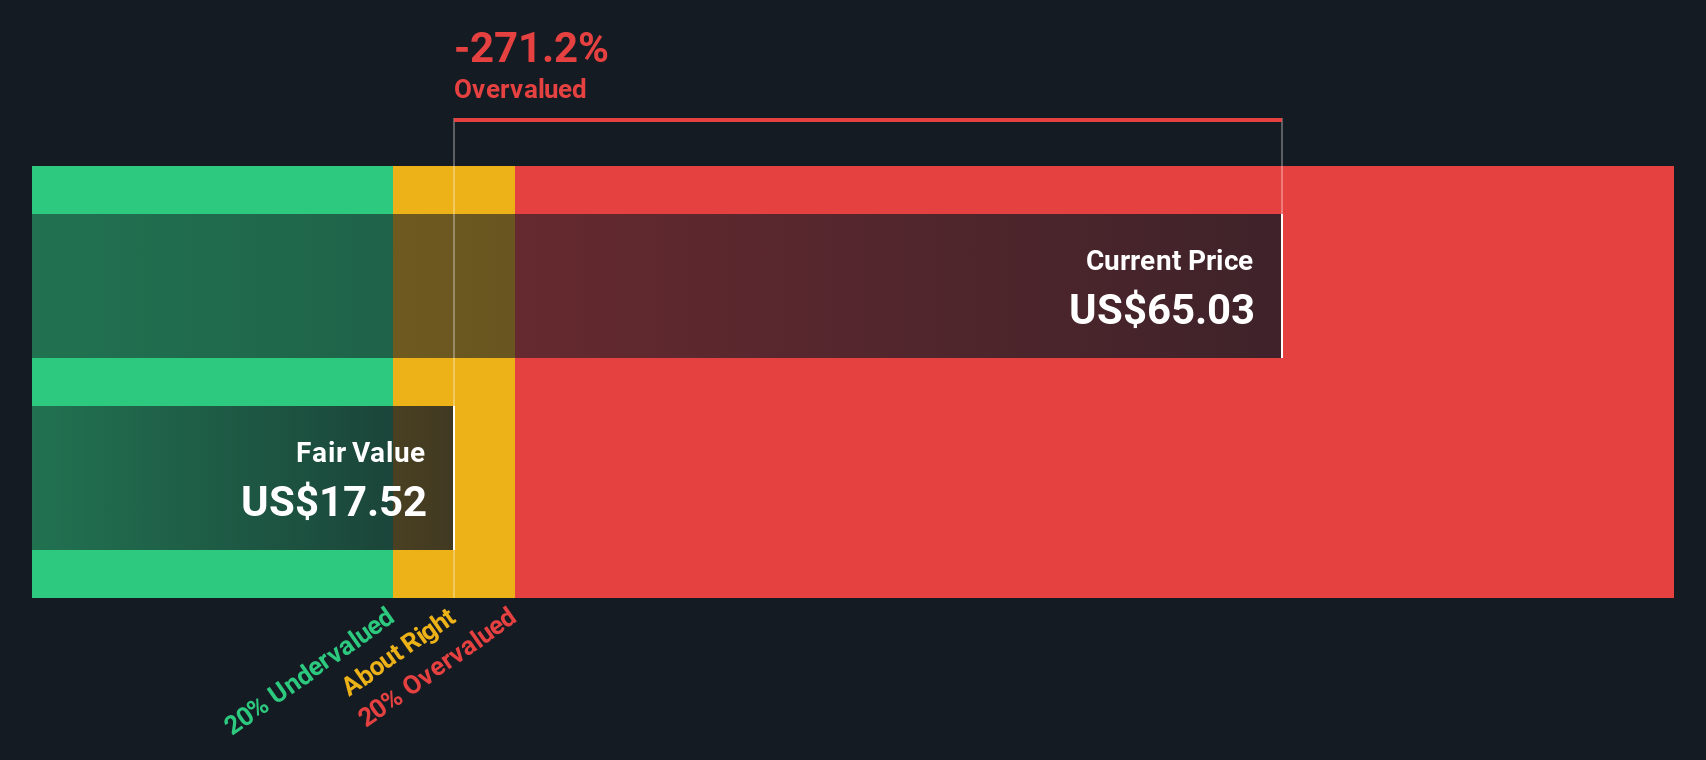
Combining these inputs, the Excess Returns model produces an intrinsic value estimate of about $38.81 per share. Compared with the recent share price of $75.35, this framework implies the stock is 94.1% overvalued on this measure.
Result: OVERVALUED
Our Excess Returns analysis suggests Interactive Brokers Group may be overvalued by 94.1%. Discover 888 undervalued stocks or create your own screener to find better value opportunities.
Approach 2: Interactive Brokers Group Price vs Earnings
For a profitable company like Interactive Brokers Group, the P/E ratio is a straightforward way to see how much you are paying for each dollar of earnings. In general, higher expected earnings growth and lower perceived risk tend to justify a higher “normal” P/E, while lower growth expectations or higher risk usually point to a lower one.
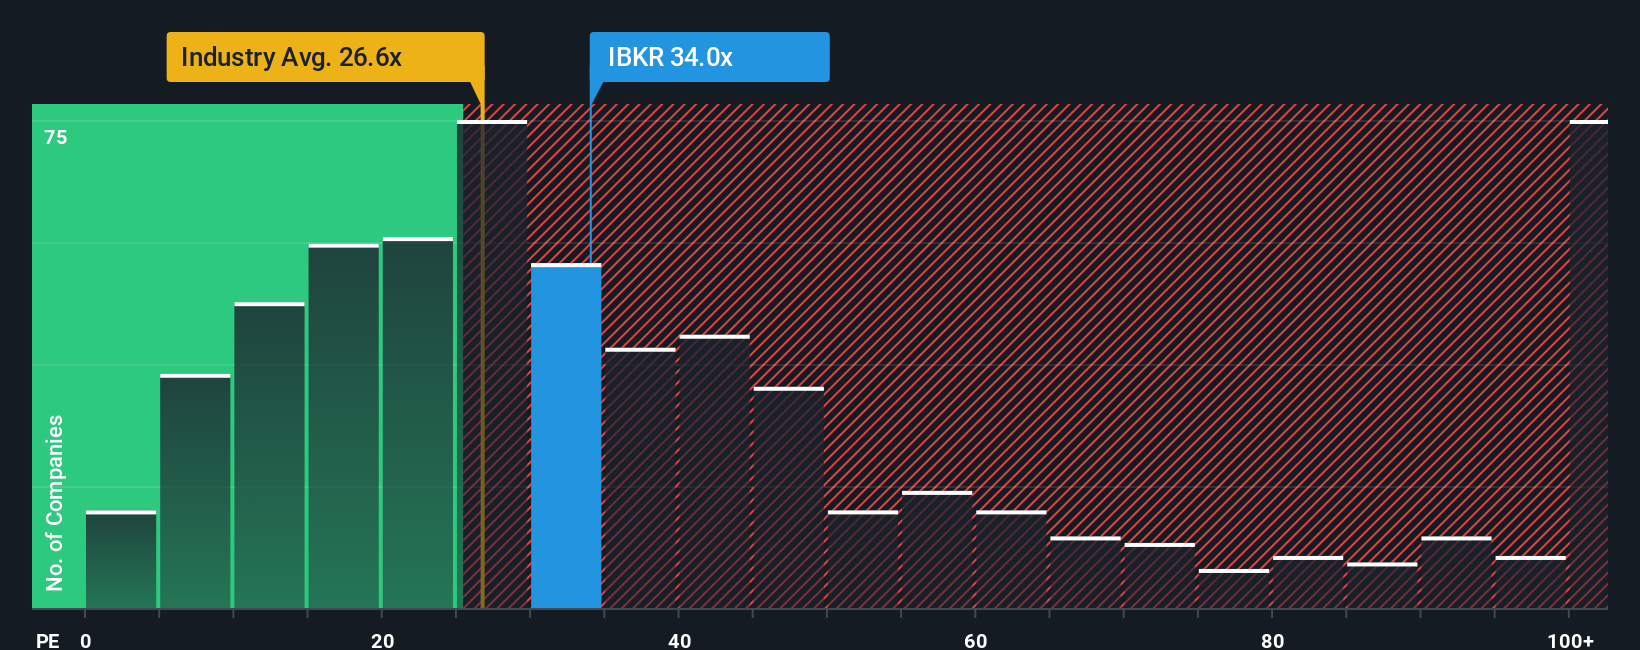
Interactive Brokers Group currently trades on a P/E of 34.10x. That sits above the Capital Markets industry average P/E of 24.41x, and also above the peer group average of 25.31x. On the surface, that suggests investors are paying a higher price for its earnings than for many industry peers.
Simply Wall St’s Fair Ratio for Interactive Brokers Group is 21.69x. This is a proprietary P/E estimate that aims to reflect what would be reasonable for the company, after considering factors like its earnings growth profile, industry, profit margins, market cap and risk characteristics. Because it is tailored to the company rather than just comparing it with broad industry or peer averages, it can be a more targeted gauge of value. With the actual P/E of 34.10x above the Fair Ratio of 21.69x, the shares look expensive on this measure.
Result: OVERVALUED
P/E ratios tell one story, but what if the real opportunity lies elsewhere? Discover 1425 companies where insiders are betting big on explosive growth.
Upgrade Your Decision Making: Choose your Interactive Brokers Group Narrative
Earlier we mentioned that there is an even better way to understand valuation, so let us introduce you to Narratives, a simple way for you to attach your own story about Interactive Brokers Group to the numbers you see, including your view of fair value and your expectations for future revenue, earnings and margins.
A Narrative links three things: the company story you believe, the financial forecast that flows from that story, and the fair value that forecast suggests, so you can compare your Fair Value to the current price and decide whether the stock looks attractive or not for you personally.
On Simply Wall St, Narratives live on the Community page, where millions of investors can see different views in a clear, accessible format, with each Narrative automatically updating when fresh information like news or earnings is added to the platform.
For Interactive Brokers Group, one investor might build a Narrative that points to a much higher fair value based on optimistic assumptions about future earnings, while another might create a more cautious Narrative with a lower fair value because they expect more modest profitability.
Do you think there's more to the story for Interactive Brokers Group? Head over to our Community to see what others are saying!
This article by Simply Wall St is general in nature. We provide commentary based on historical data and analyst forecasts only using an unbiased methodology and our articles are not intended to be financial advice. It does not constitute a recommendation to buy or sell any stock, and does not take account of your objectives, or your financial situation. We aim to bring you long-term focused analysis driven by fundamental data. Note that our analysis may not factor in the latest price-sensitive company announcements or qualitative material. Simply Wall St has no position in any stocks mentioned.