
Please use a PC Browser to access Register-Tadawul
Get It
Is It Too Late To Consider Targa Resources (TRGP) After Its Strong Multiyear Run?
Targa Resources Corp. TRGP | 231.35 | +3.21% |
Targa Resources scores just 2/6 on our valuation checks. See what other red flags we found in the full valuation breakdown.
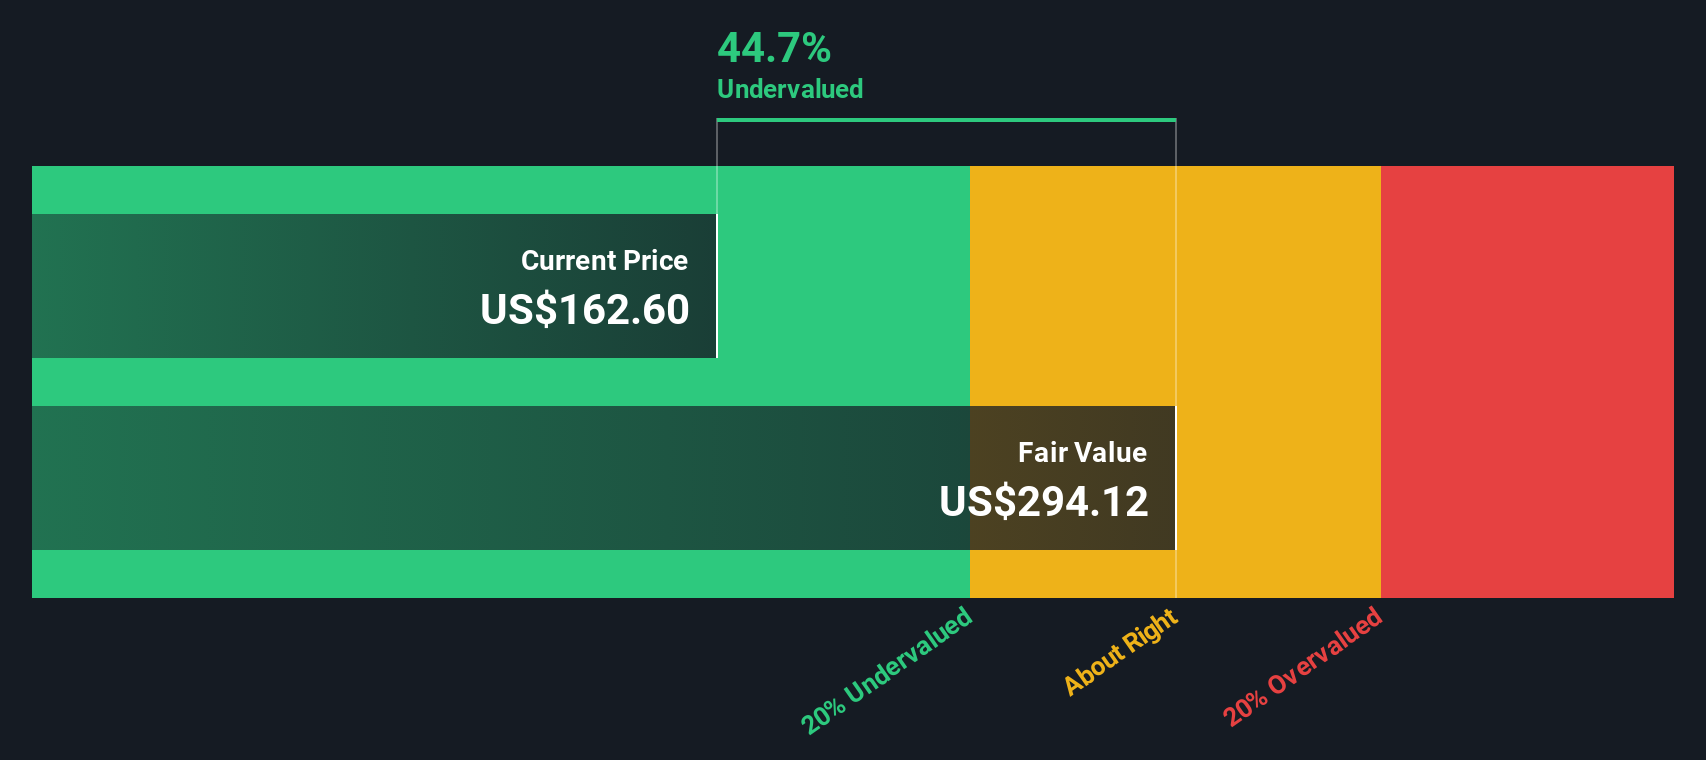
A Discounted Cash Flow, or DCF, model projects a company’s future cash flows and then discounts them back to today’s dollars to estimate what the business might be worth right now.
For Targa Resources, the model used is a 2 Stage Free Cash Flow to Equity approach. The latest twelve month free cash flow is about $874.1 million. Analyst and extrapolated projections suggest free cash flow could reach $3.0 billion in 2030, with a path that includes estimates such as $887.5 million in 2026 and a $2.9 billion range in the early 2030s, all in dollar terms. Simply Wall St discounts each of these projected cash flows back to today using its own assumptions to arrive at a per share estimate.
On this basis, the DCF model points to an estimated intrinsic value of about $280.80 per share for Targa Resources, compared with the recent share price of $223.89. That implies the stock is around 20.3% below the DCF estimate of fair value.
Result: UNDERVALUED
Our Discounted Cash Flow (DCF) analysis suggests Targa Resources is undervalued by 20.3%. Track this in your watchlist or portfolio, or discover 53 more high quality undervalued stocks.
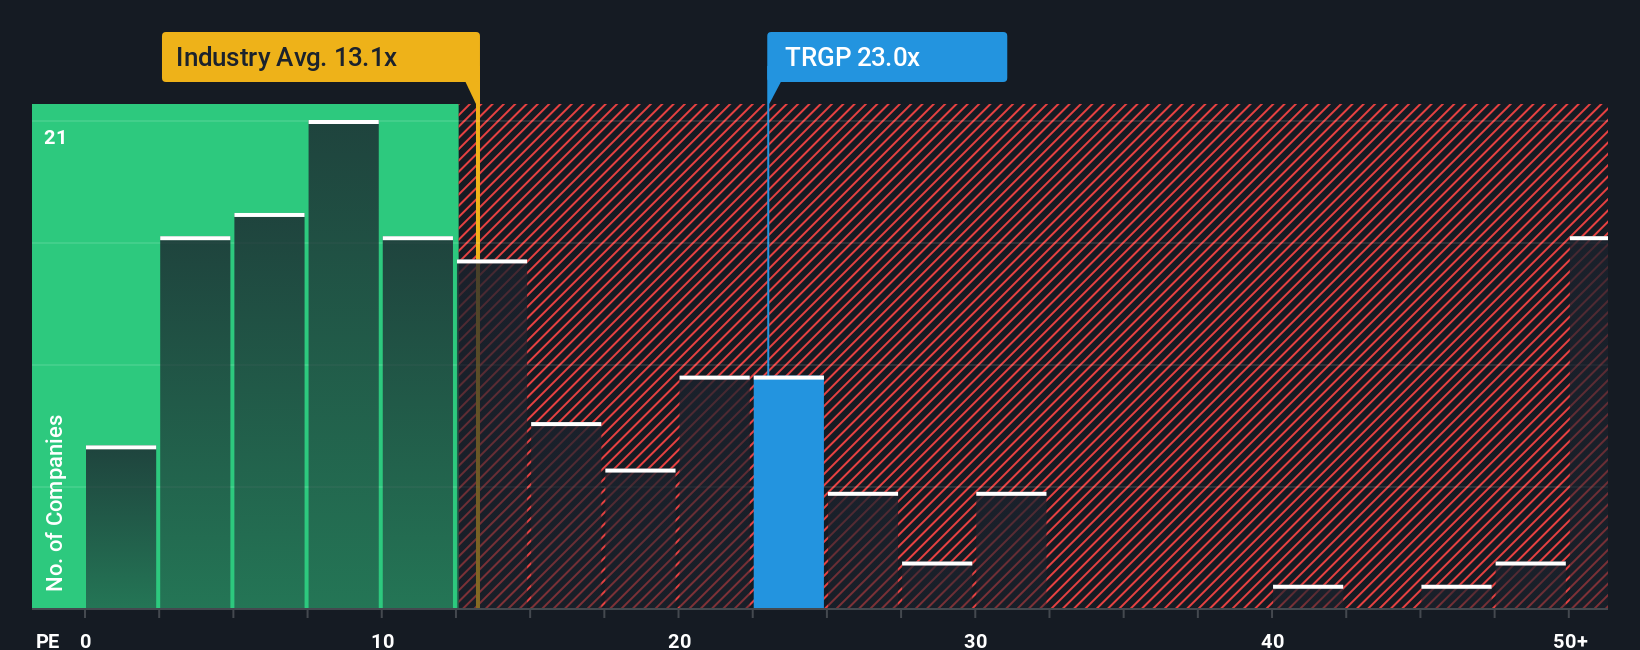
For a profitable company like Targa Resources, the P/E ratio is a straightforward way to see how much investors are paying for each dollar of earnings. Higher growth expectations and lower perceived risk usually justify a higher P/E, while slower growth or higher risk tend to line up with a lower, more conservative P/E.
Targa Resources is currently trading on a P/E of 29.75x. That sits well above the Oil and Gas industry average P/E of 14.46x and also above the peer average of 15.52x. Simply Wall St’s Fair Ratio framework estimates what a more tailored P/E might look like for Targa Resources, given factors such as its earnings growth profile, industry, profit margins, market cap and specific risks, and arrives at a Fair Ratio of 23.11x.
This Fair Ratio is designed to be more useful than a simple industry or peer comparison because it adjusts for company specific characteristics rather than assuming one size fits all. Comparing the Fair Ratio of 23.11x with the actual P/E of 29.75x suggests the shares are priced above what this model would consider a more neutral level.
Result: OVERVALUED
P/E ratios tell one story, but what if the real opportunity lies elsewhere? Start investing in legacies, not executives. Discover our 23 top founder-led companies.
Earlier we mentioned that there is an even better way to understand valuation. Let us introduce you to Narratives, which are simply your story about Targa Resources translated into assumptions for future revenue, earnings and margins. These are then linked to a fair value estimate that you can compare with today’s price, all within an easy tool on Simply Wall St’s Community page that millions of investors use. The tool keeps updating as new news or earnings come in. For example, one investor might build a bullish Targa Resources Narrative around higher Permian volumes, expanding export infrastructure and a fair value near the upper analyst price target of US$240.0. Another might create a more cautious Narrative focused on competition, overbuild risk and regulation with a fair value closer to the US$186.0 lower analyst target. This gives you a clear, numbers-based way to decide how your own fair value stacks up against the live share price.
Do you think there's more to the story for Targa Resources? Head over to our Community to see what others are saying!
This article by Simply Wall St is general in nature. We provide commentary based on historical data and analyst forecasts only using an unbiased methodology and our articles are not intended to be financial advice. It does not constitute a recommendation to buy or sell any stock, and does not take account of your objectives, or your financial situation. We aim to bring you long-term focused analysis driven by fundamental data. Note that our analysis may not factor in the latest price-sensitive company announcements or qualitative material. Simply Wall St has no position in any stocks mentioned.
