
Please use a PC Browser to access Register-Tadawul
Get It
Is Liberty Energy (LBRT) Pricing Reflect Future Cash Flows After Recent Share Price Rebound
Liberty Energy, Inc. Class A LBRT | 26.85 | -0.15% |
A Discounted Cash Flow, or DCF, model takes estimates of the cash Liberty Energy could generate in future years and discounts those cash flows back into today’s dollars to arrive at an estimate of what the business might be worth now.
For Liberty Energy, the model used here is a 2 Stage Free Cash Flow to Equity approach. The company’s latest twelve month free cash flow is about $69.4 million. Analyst estimates and subsequent extrapolations point to free cash flow reaching $235 million in 2030, with a series of projected cash flows between 2026 and 2035 that include both losses and positive figures, all expressed in dollars and discounted back to today.
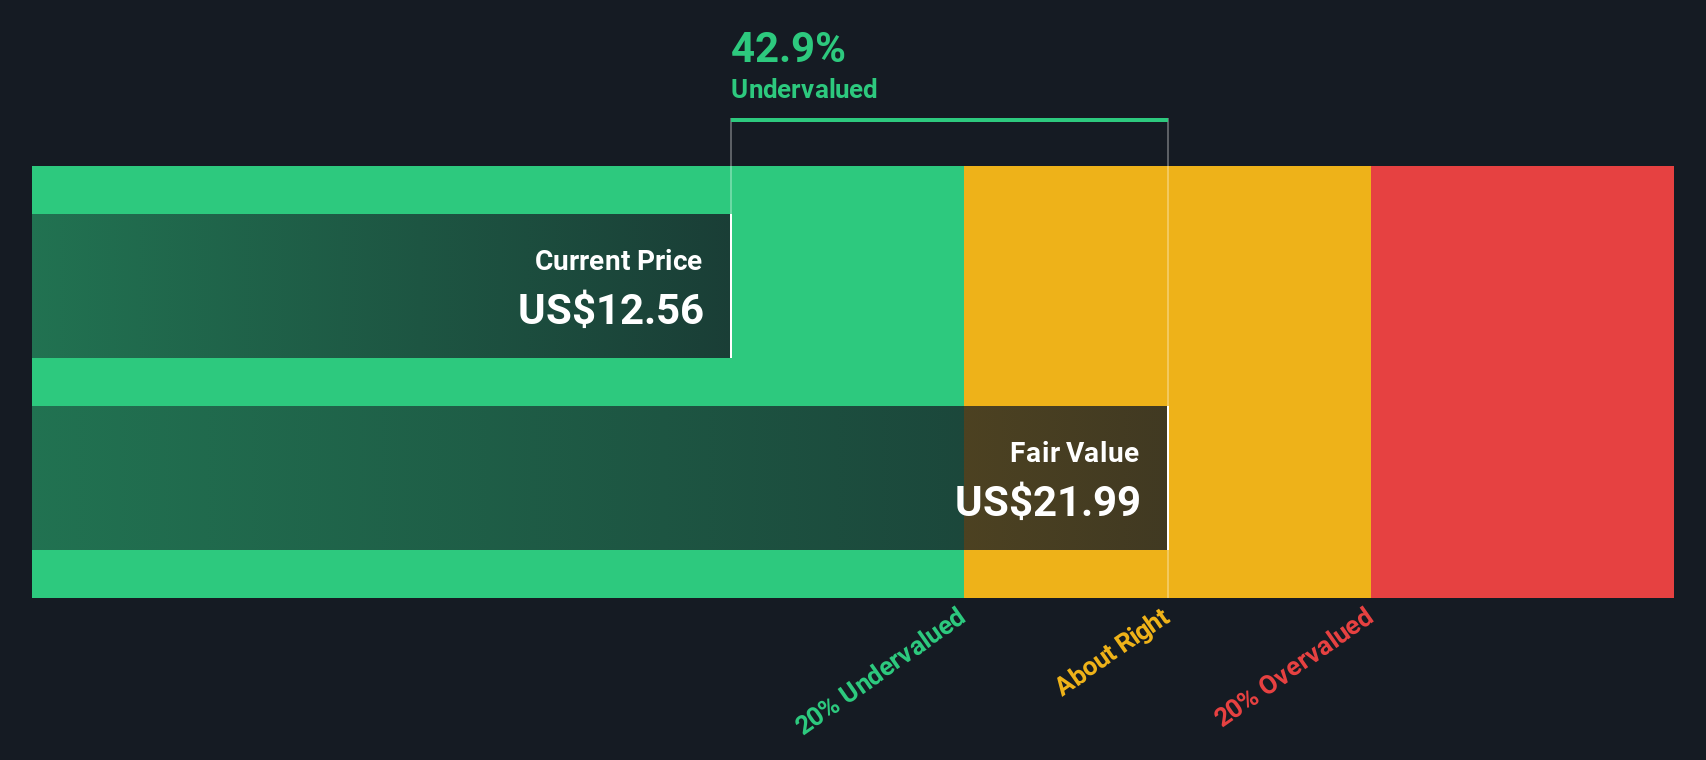
Putting all of those projected and discounted cash flows together, the model arrives at an estimated intrinsic value of about $33.39 per share, compared with a recent share price of $21.22. On this basis, the DCF suggests Liberty Energy may be about 36.5% undervalued at the moment.
Result: UNDERVALUED
Our Discounted Cash Flow (DCF) analysis suggests Liberty Energy is undervalued by 36.5%. Track this in your watchlist or portfolio, or discover 877 more undervalued stocks based on cash flows.
For profitable companies, the P/E ratio is a straightforward way to link what you pay for a share to the earnings that each share generates. In general, higher growth expectations and lower perceived risk can justify a higher “normal” P/E, while slower growth or higher risk usually line up with a lower multiple.
Liberty Energy currently trades on a P/E of 18.47x. That sits below the Energy Services industry average P/E of 22.15x and also below the broader peer group average of 37.01x. Simply Wall St’s “Fair Ratio” for Liberty Energy is 8.48x. This is a proprietary estimate of the P/E that might be reasonable given factors such as the company’s earnings growth profile, its industry, profit margins, market cap and specific risk characteristics.
This Fair Ratio is more tailored than a simple comparison to peers or the industry, because it adjusts for company level drivers rather than assuming that all businesses should trade on the same multiple. Comparing Liberty Energy’s current P/E of 18.47x with the Fair Ratio of 8.48x suggests the shares are trading above this modelled range.
Result: OVERVALUED

P/E ratios tell one story, but what if the real opportunity lies elsewhere? Discover 1444 companies where insiders are betting big on explosive growth.
Earlier we mentioned that there is an even better way to understand valuation, so let us introduce you to Narratives. Narratives let you attach a story, your view on a company’s future revenue, earnings, margins and fair value, to the hard numbers you have already seen.
A Narrative connects three pieces: what you think is happening at the company, how that might shape a financial forecast, and what fair value that implies for the shares, so you are not just looking at ratios in isolation.
On Simply Wall St, Narratives sit inside the Community page and are used by millions of investors. They give you a straightforward tool you can use to compare your own fair value with the current share price and decide whether you see Liberty Energy as closer to a buy, a sell, or a hold for your portfolio.
Because Narratives update when new information such as company news or earnings is added, your view of fair value can shift automatically. You might see one Liberty Energy Narrative where an investor assumes a higher fair value based on a more optimistic revenue and margin path, while another investor uses lower forecasts and a more conservative discount rate to arrive at a lower fair value, even though both are looking at the same company today.
Do you think there's more to the story for Liberty Energy? Head over to our Community to see what others are saying!
This article by Simply Wall St is general in nature. We provide commentary based on historical data and analyst forecasts only using an unbiased methodology and our articles are not intended to be financial advice. It does not constitute a recommendation to buy or sell any stock, and does not take account of your objectives, or your financial situation. We aim to bring you long-term focused analysis driven by fundamental data. Note that our analysis may not factor in the latest price-sensitive company announcements or qualitative material. Simply Wall St has no position in any stocks mentioned.
