Is lululemon a Bargain After Plunging 55% With Weaker US Sales in 2025?
lululemon athletica inc. LULU | 153.10 | +4.99% |
If you hold shares of lululemon athletica or are thinking about adding the stock to your list, you've likely watched its price whipsaw back and forth this year. After years of outpacing peers, lululemon is now down 55.0% year-to-date and nearly cut in half over the past five years. That is a tough pill to swallow for long-term investors who stuck it out, especially in a market that has had flashes of optimism elsewhere.
So, what is moving the needle on lululemon’s price? A swirl of factors, from industry-wide shifts in consumer discretionary spending to intense competition in athletic wear, has cast a new spotlight on the company’s risk profile. Recent months saw a modest 2.4% rise in the share price over 30 days, yet the broader trend points to a recalibration in how the market values this once high-flier. The stock’s small dip of 0.1% in the last week suggests investors are still weighing their next move carefully.
But here is where things get interesting. Even with all this volatility, a dive into different valuation checks suggests the market may have overcorrected. On a 6-point scale assessing undervaluation across major financial yardsticks, lululemon scores a 5. That is no small feat and implies the company is undervalued on nearly all key metrics we look for.
Curious which valuation methods back up that score and what they mean for your investment decision? Let us walk through the approaches, then explore an even better way to size up lululemon’s true value at the end.
Approach 1: lululemon athletica Discounted Cash Flow (DCF) Analysis
The Discounted Cash Flow (DCF) approach estimates a company’s intrinsic value by projecting its future cash flows and discounting them back to today, accounting for risk and the time value of money. For lululemon athletica, the DCF model uses a 2 Stage Free Cash Flow to Equity framework, drawing on both analyst estimates and long-term extrapolations.
Currently, lululemon generates Free Cash Flow (FCF) of $1.16 billion, and analysts expect this figure to steadily increase. In five years, FCF is projected to reach $1.39 billion, with further growth anticipated and topping $1.60 billion by 2030. The initial years rely on consensus analyst forecasts, while predictive modeling carries projections even further and builds on lululemon’s continued momentum.
Based on these calculations, the DCF model arrives at an estimated fair value of $256.12 per share. Compared to lululemon’s current price, this suggests the stock is trading at a 34.6% discount to its calculated intrinsic value and is considered undervalued.
Result: UNDERVALUED
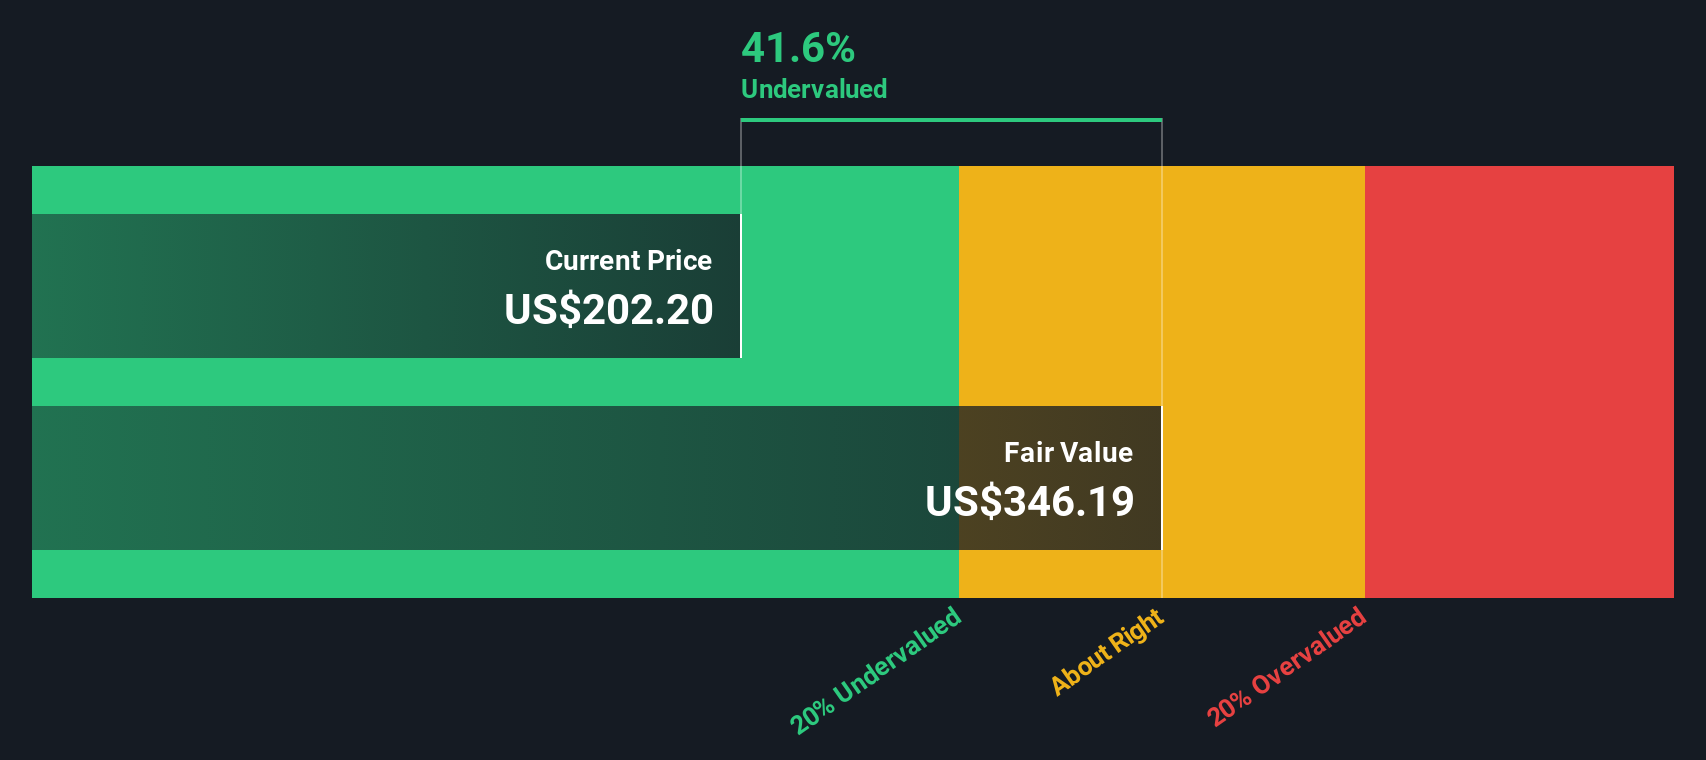
Our Discounted Cash Flow (DCF) analysis suggests lululemon athletica is undervalued by 34.6%. Track this in your watchlist or portfolio, or discover more undervalued stocks.
Approach 2: lululemon athletica Price vs Earnings
The Price-to-Earnings (PE) ratio is widely regarded as the go-to metric for valuing profitable companies like lululemon athletica. It provides a direct snapshot of how much investors are willing to pay for each dollar of the company’s earnings, offering a straightforward apples-to-apples way to compare businesses of different sizes or across industries.
What makes a "normal" or "fair" PE ratio can change, depending on expectations for growth and the risks a company faces. Higher growth or lower risk can justify paying a premium, reflected in a higher PE, while lower growth or greater risk typically demands a discount. It is crucial to keep these dynamics in mind instead of relying on headline multiples alone.
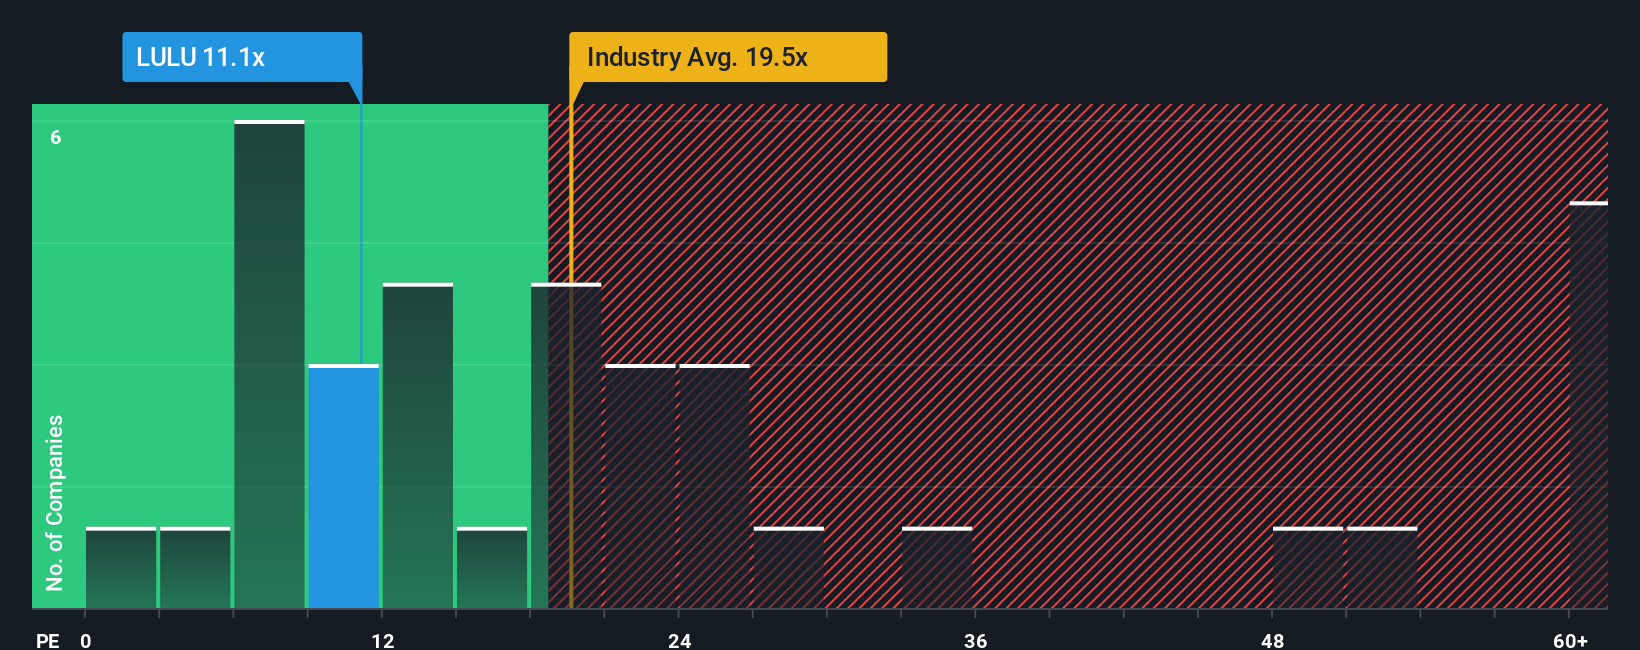
lululemon currently trades at an 11.1x PE ratio. By comparison, the Luxury industry averages a PE of 19.4x and lululemon’s peers command an even higher average at 62.2x. But numbers do not tell the whole story. Simply Wall St’s proprietary “Fair Ratio” for lululemon is 17.2x, which takes into account not only industry trends and profit margins but also the company’s own earnings growth, risk factors, and market capitalization. This tailored approach makes it a more relevant benchmark than a simple peer or industry average. Since lululemon's current PE is below its Fair Ratio, the stock appears undervalued through this lens.
Result: UNDERVALUED
PE ratios tell one story, but what if the real opportunity lies elsewhere? Discover companies where insiders are betting big on explosive growth.
Upgrade Your Decision Making: Choose your lululemon athletica Narrative
Earlier we mentioned that there is an even better way to understand valuation, so let us introduce you to Narratives. A Narrative is your perspective or story about a company that ties together your assumptions about its future (like expected growth, profit margins, and risks) with a financial forecast and a fair value estimate. Narratives are an intuitive way to ground your investing decisions in actual business drivers, not just stock prices.
On Simply Wall St’s Community page, you can explore, create, and update Narratives. This tool is both accessible and dynamic. Narratives empower investors to decide when to buy or sell by directly comparing their own Fair Value against the current share price, and these fair values are automatically updated when new information, such as earnings or news events, arrives. Your story always reflects the latest facts.
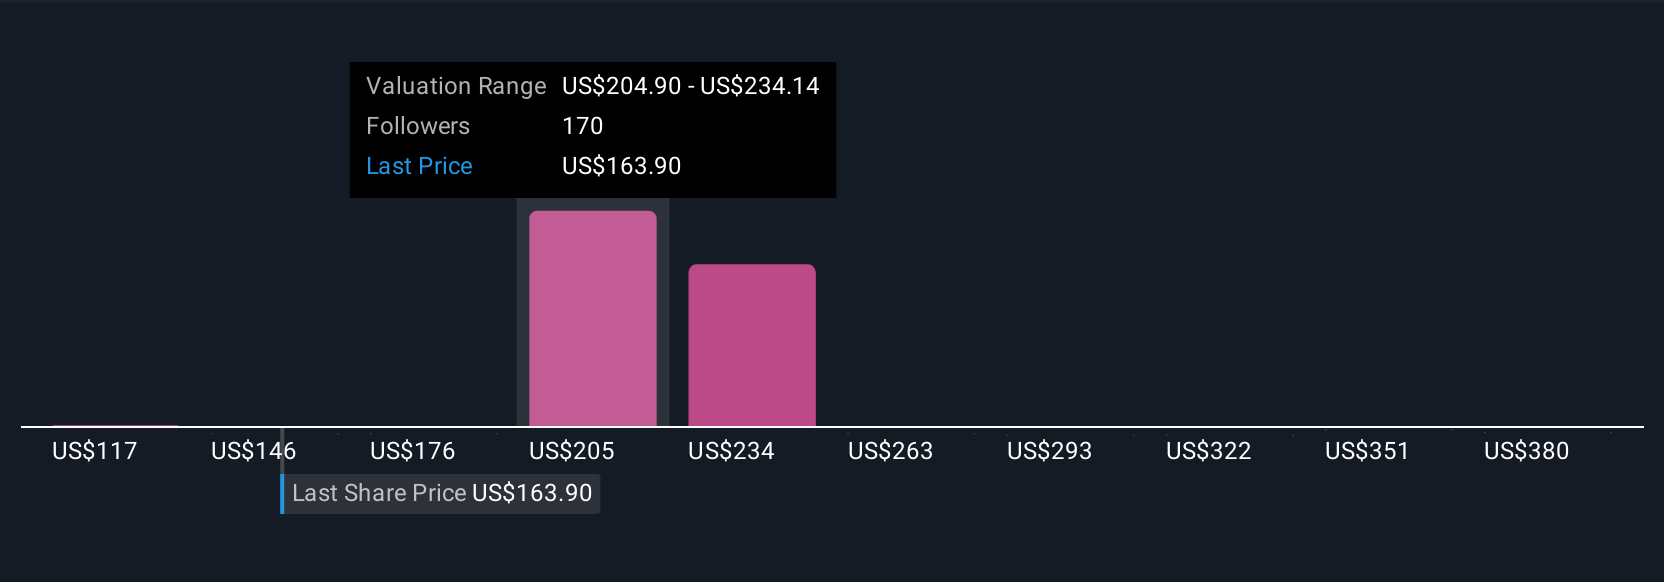
For instance, one investor’s Narrative for lululemon athletica is optimistic, forecasting a fair value of nearly $226 per share based on strong growth, while another is more cautious, placing fair value at just $100 because of risks like declining US sales and rising competition. By comparing these Narratives, you can gain a clearer, more tailored view of whether lululemon’s current price matches your own outlook and comfort level.
Do you think there's more to the story for lululemon athletica? Create your own Narrative to let the Community know!
This article by Simply Wall St is general in nature. We provide commentary based on historical data and analyst forecasts only using an unbiased methodology and our articles are not intended to be financial advice. It does not constitute a recommendation to buy or sell any stock, and does not take account of your objectives, or your financial situation. We aim to bring you long-term focused analysis driven by fundamental data. Note that our analysis may not factor in the latest price-sensitive company announcements or qualitative material. Simply Wall St has no position in any stocks mentioned.