
Please use a PC Browser to access Register-Tadawul
Get It
Is Medtronic’s Recent 4.7% Climb Justified After Strong Q4 Results?
Medtronic Plc MDT | 89.47 | +0.56% |
If you are on the fence about what to do with Medtronic stock right now, you are not alone. Investors have watched Medtronic’s share price make some pretty interesting moves recently, leading many to wonder whether its current valuation holds the secret to future gains or red flags. Over just the past week, the stock climbed 4.7%, and it is up 6.0% over the last month. For those who bought in at the start of the year, the story is even more upbeat, with year-to-date returns clocking in at an impressive 22.7%. Even zooming out, Medtronic has delivered nearly 33% returns over three years and 16.8% in the past twelve months, while its five-year gain paints a more modest 4.6%.
Much of this momentum has been shaped by shifting market dynamics. Growing confidence in the healthcare sector and Medtronic’s position as an industry leader have clearly boosted sentiment, even as broader market trends create pockets of caution and opportunity. News of innovation in medical devices and evolving regulatory landscapes seem to be fueling investor optimism and signaling lower perceived risk for Medtronic’s business model.
But what about the stock’s price in relation to its actual value? That is where things get really interesting. Right now, Medtronic has a valuation score of 3 out of 6 checks for undervaluation. This middling result suggests there is more to the story than meets the eye. In the next sections, we will dig into how each valuation approach lines up for Medtronic. Keep reading for a perspective on valuation that might just change how you look at the stock altogether.
A Discounted Cash Flow (DCF) model aims to estimate a company’s true worth by projecting its future cash flows and then discounting those values back to today. In essence, this shows what those future earnings are worth in current dollars. This approach provides a detailed look at long-term value based on tangible cash generation.
For Medtronic, the most recent Free Cash Flow stands at $5.41 billion. Analysts forecast steady growth, projecting Free Cash Flow to reach $6.94 billion by 2028. After this period, further projections, extending out to 2035, are extrapolated and suggest continued, moderate growth based on industry expectations and past performance.
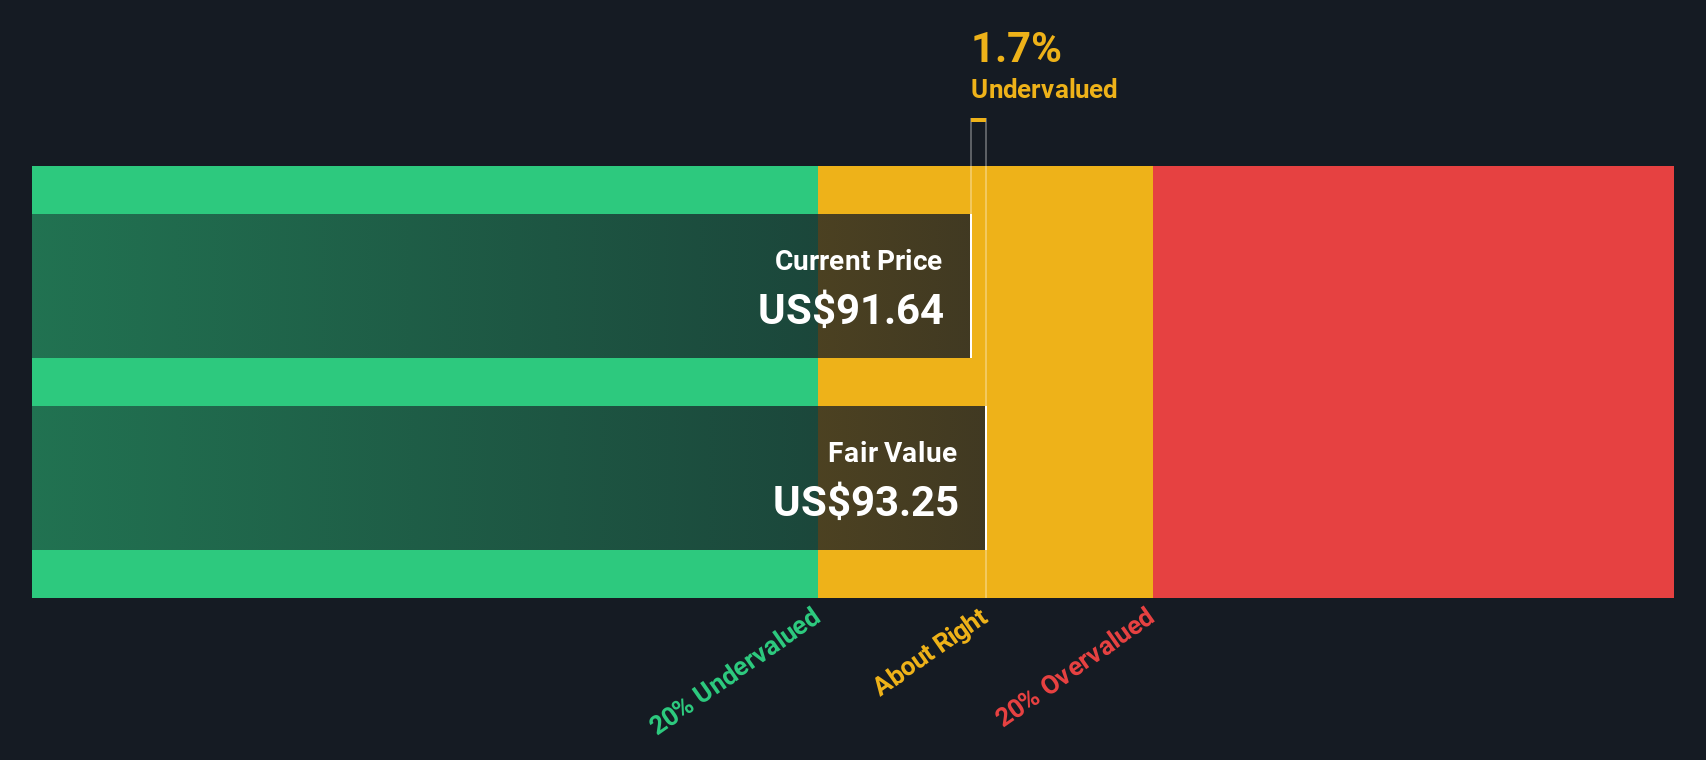
After crunching the numbers, the DCF model sets Medtronic’s intrinsic value at $97.83 per share. Compared to its current stock price, this signals a slight 0.6% overvaluation. This narrow margin suggests that the market’s present outlook for Medtronic is closely aligned with its underlying value, with little immediate upside or downside.
Result: ABOUT RIGHT
Simply Wall St performs a valuation analysis on every stock in the world every day (check out Medtronic's valuation analysis). We show the entire calculation in full. You can track the result in your watchlist or portfolio and be alerted when this changes.
The Price-to-Earnings (PE) ratio is one of the most widely used metrics for valuing profitable companies like Medtronic. It offers a quick snapshot of what investors are willing to pay today for a dollar of current earnings. Since Medtronic consistently generates profits, the PE ratio is especially relevant here.
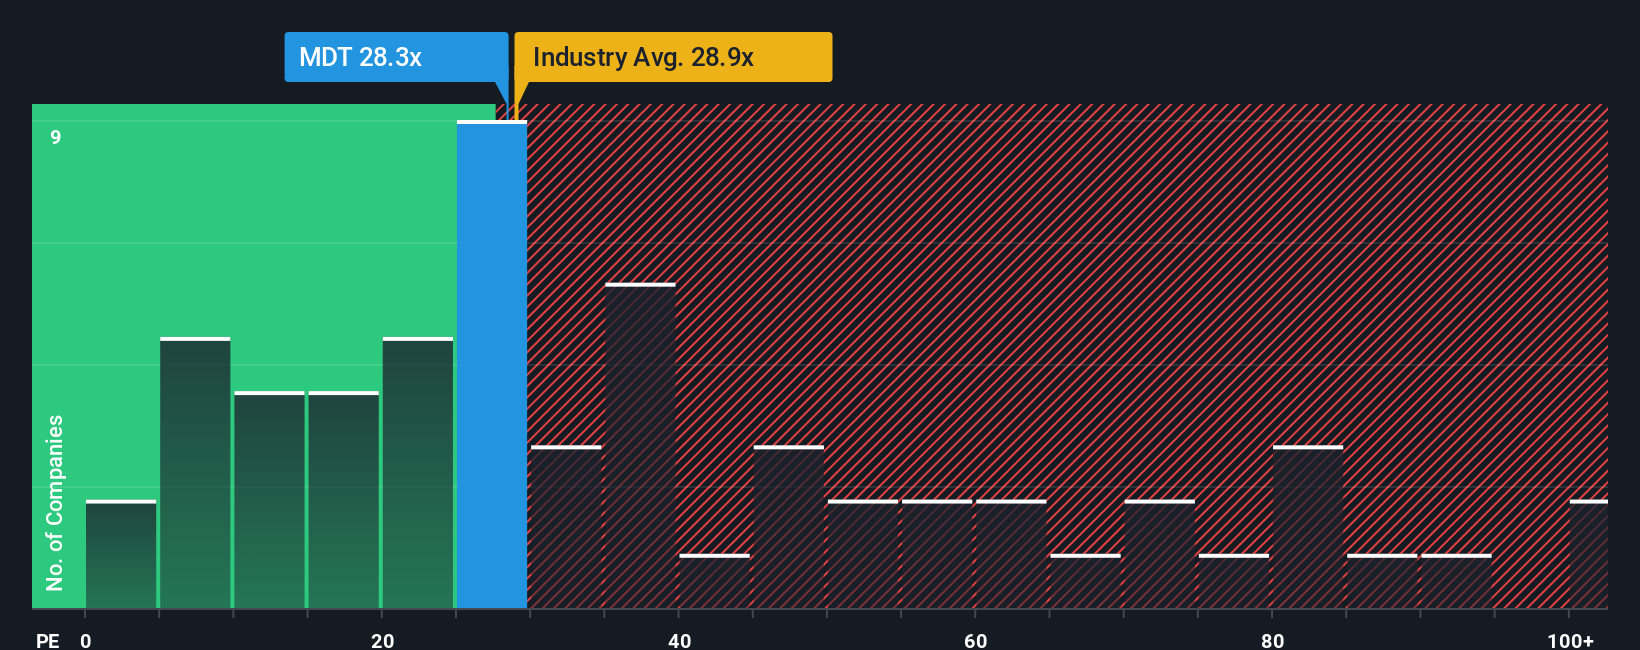
The "right" PE ratio to expect can change depending on future growth prospects and the level of risk. Higher expected growth or lower risk typically justifies a higher PE, while more uncertainty or slower growth warrants a lower multiple. For context, Medtronic trades at a PE ratio of 27.1x, which is somewhat below both the peer average of 45.9x and the Medical Equipment industry’s average of 30.6x.
Simply Wall St’s proprietary Fair Ratio helps to refine this comparison. Rather than relying only on sector averages or peer groups, the Fair Ratio reflects a tailored view of what is reasonable for Medtronic, factoring in growth plans, profit margins, competitive risks, and overall market cap. In Medtronic’s case, the Fair Ratio stands at 28.0x. Comparing this to the actual PE ratio of 27.1x, the stock looks appropriately valued, with only a marginal difference between the two metrics.
Result: ABOUT RIGHT
PE ratios tell one story, but what if the real opportunity lies elsewhere? Discover companies where insiders are betting big on explosive growth.
Earlier we hinted at a better way to understand valuation. Let’s introduce you to Narratives, an intuitive approach that connects the story you believe about Medtronic’s future with a financial forecast and, ultimately, a fair value estimate.
At its core, a Narrative is simply your personal take on a company, blending your expectations for future revenue, earnings and margins with the numbers you think are likely. Narratives bring the bigger picture together, showing how news, innovation, and business developments shape your financial outlook and making valuation a dynamic, living process rather than a static number.
On Simply Wall St’s platform, millions of investors are using Narratives via the Medtronic Community page to test investing ideas, scan the latest opinions, and track evolving fair value estimates. All of these updates are reflected automatically with each new earnings report or major news event.
This means you can easily see how your view compares to others and decide whether to buy or sell by checking if your Narrative’s fair value is above or below the current price. You can also adapt quickly as the facts change. For example, the most optimistic Medtronic Narrative on the Community forecasts upside to $112 per share, while the most cautious expects just $82. This demonstrates how real investors turn their stories into actionable decisions.
For Medtronic, here are previews of two leading Medtronic Narratives:
Fair Value: $98.63
Current Price vs. Fair Value: -0.2%
Revenue Growth Forecast: 5.4%
Fair Value: $95.00
Current Price vs. Fair Value: +3.6%
Revenue Growth Forecast: 5.2%
Do you think there's more to the story for Medtronic? Create your own Narrative to let the Community know!

This article by Simply Wall St is general in nature. We provide commentary based on historical data and analyst forecasts only using an unbiased methodology and our articles are not intended to be financial advice. It does not constitute a recommendation to buy or sell any stock, and does not take account of your objectives, or your financial situation. We aim to bring you long-term focused analysis driven by fundamental data. Note that our analysis may not factor in the latest price-sensitive company announcements or qualitative material. Simply Wall St has no position in any stocks mentioned.
