
Please use a PC Browser to access Register-Tadawul
Get It
Is PBF Energy (PBF) Fairly Priced After Recent Share Price Strength?
PBF Energy, Inc. Class A PBF | 34.38 | +1.42% |
The Dividend Discount Model looks at a stock by estimating the value of all future dividends, then discounting them back to today. It essentially asks what those dividend payments are worth in total if you required a reasonable return for holding the shares.
For PBF Energy, the model uses a recent dividend per share of about US$1.12, a return on equity of 31.75% and a payout ratio of roughly 120%. Because that payout ratio is high, the model caps long term dividend growth at 3.26%, even though the raw inputs would imply much faster growth. This is intended to keep the projections more restrained and tied to what may be sustainable over time.
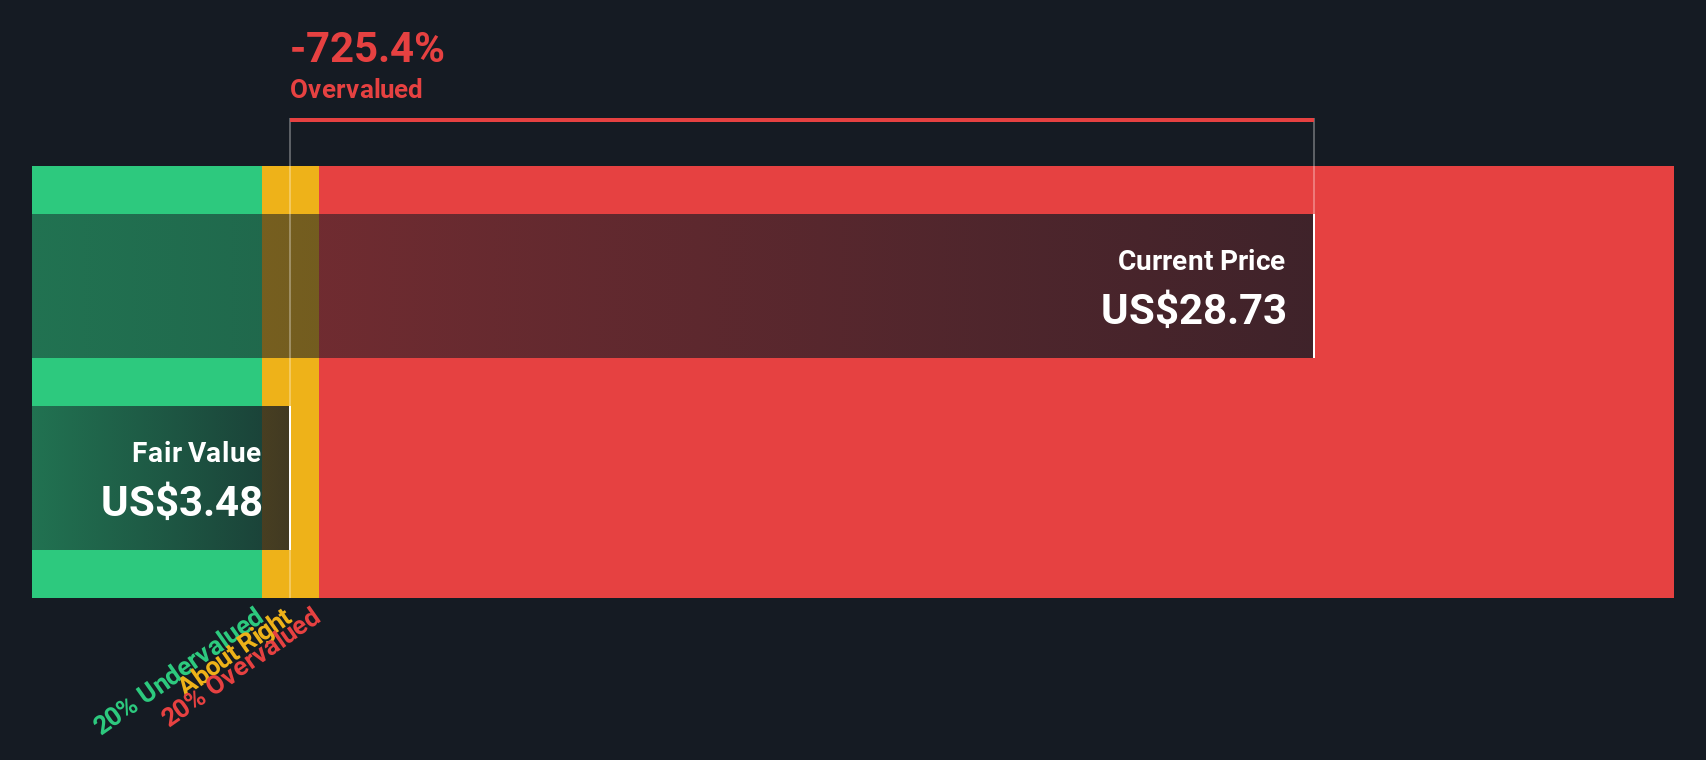
Using these assumptions, the DDM output suggests an intrinsic value of about US$30.27 per share, compared with the current price around US$32.42. In this dividend-focused view, PBF Energy appears to trade at roughly a 7.1% premium to the model’s estimate of intrinsic value.
Result: ABOUT RIGHT
PBF Energy is fairly valued according to our Dividend Discount Model (DDM), but this can change at a moment's notice. Track the value in your watchlist or portfolio and be alerted on when to act.
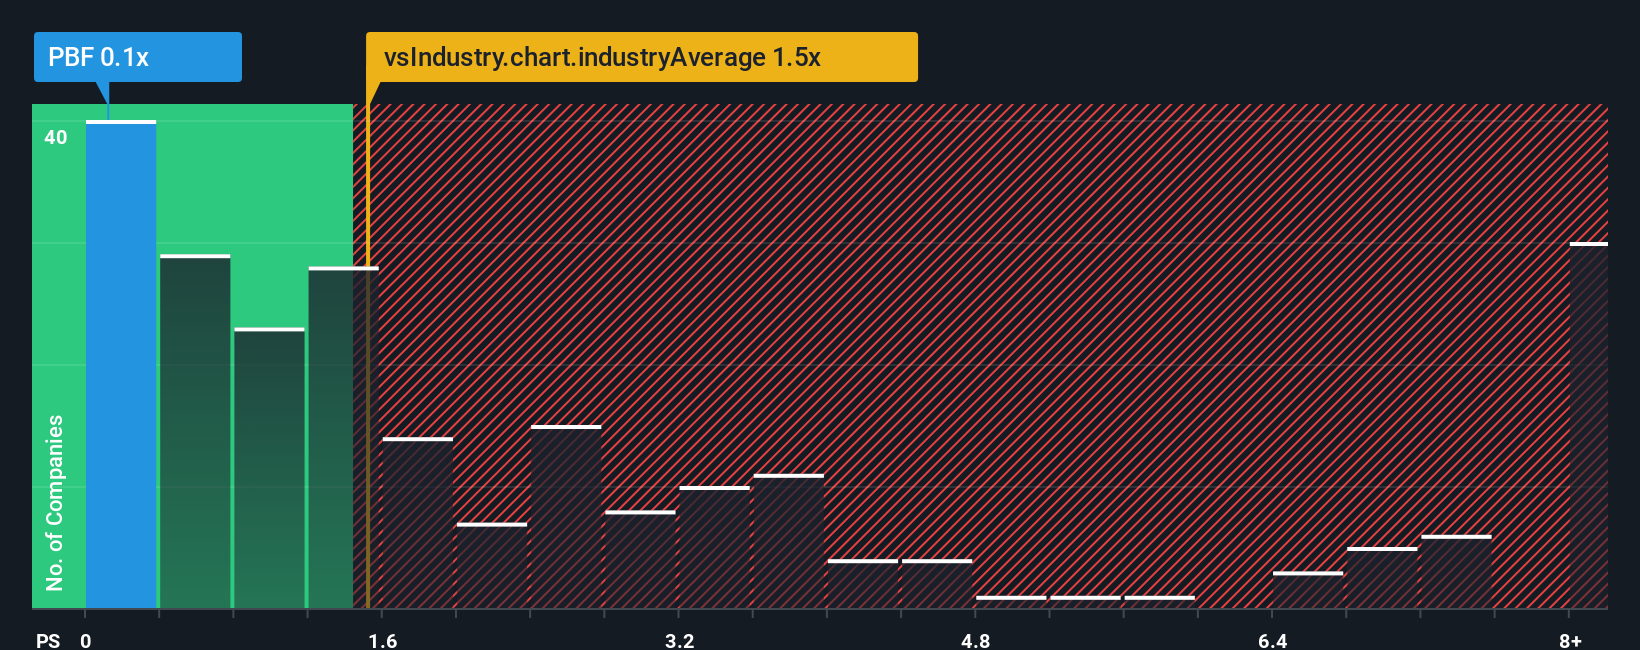
For companies where earnings can swing around, P/S is often a useful cross check because sales tend to be more stable than profits and less affected by one off items. It gives you a quick sense of what investors are paying for each dollar of revenue.
In general, higher expected growth and lower perceived risk justify a higher “normal” P/S multiple. Slower growth or higher risk usually means a lower multiple is more appropriate. These are broad tendencies rather than hard rules, but they help frame what might be reasonable.
PBF Energy currently trades on a P/S of about 0.13x. That sits below the Oil and Gas industry average P/S of 1.55x and also below the peer average of 0.22x. Simply Wall St’s Fair Ratio for PBF Energy is 0.43x, which is its estimate of a suitable P/S once factors like earnings growth, profit margins, industry, market cap and key risks are taken into account.
This Fair Ratio is more tailored than a simple comparison with peers or the broad industry, because it adjusts for company specific characteristics rather than assuming that all refiners should trade on the same multiple.
Compared with this Fair Ratio of 0.43x, PBF Energy’s current P/S of 0.13x suggests the shares screen as undervalued on this metric.
Result: UNDERVALUED
P/S ratios tell one story, but what if the real opportunity lies elsewhere? Discover 1439 companies where insiders are betting big on explosive growth.
Earlier we mentioned that there is an even better way to understand valuation, so let us introduce you to Narratives. You set a story for PBF Energy, link that story to your own forecasts for revenue, earnings and margins, and the Simply Wall St Community tool turns it into a Fair Value you can compare with the current price. You can see in real time how new information, such as the latest analyst consensus range of US$16 to US$28, might shift bullish or cautious Narratives. You can then decide whether the gap between price and your Fair Value suggests it could be an opportunity to buy, a signal to hold off, or a point to review your thesis as the data updates.
Do you think there's more to the story for PBF Energy? Head over to our Community to see what others are saying!
This article by Simply Wall St is general in nature. We provide commentary based on historical data and analyst forecasts only using an unbiased methodology and our articles are not intended to be financial advice. It does not constitute a recommendation to buy or sell any stock, and does not take account of your objectives, or your financial situation. We aim to bring you long-term focused analysis driven by fundamental data. Note that our analysis may not factor in the latest price-sensitive company announcements or qualitative material. Simply Wall St has no position in any stocks mentioned.
