Is Pinnacle Financial Partners (PNFP) Pricing A Disconnect From Its Earnings Power?
Pinnacle Financial Partners, Inc. PNFP | 0.00 |
- If you are trying to figure out whether Pinnacle Financial Partners is attractively priced or not, you will want to see how its current share price lines up against a few different valuation checks.
- The stock closed at US$95.21, with returns of a 1.8% decline over 7 days, a 4.7% decline over 30 days, a 0.1% gain year to date, a 14.9% decline over 1 year, a 31.2% gain over 3 years and a 43.3% gain over 5 years. Taken together, this gives you a mixed picture of recent and longer-term performance.
- Recent market attention around US regional banks has kept investors focused on balance sheet resilience and funding costs. This helps frame how moves in Pinnacle Financial Partners' share price are interpreted. This context matters because valuation metrics can look very different depending on how investors are currently assessing risk in the banking sector.
- Pinnacle Financial Partners holds a valuation score of 5/6, meaning it screens as undervalued on most of the checks we use. Next, we will walk through what those different approaches are, before finishing with a more holistic way to think about what the stock might be worth.
Approach 1: Pinnacle Financial Partners Excess Returns Analysis
The Excess Returns model looks at how much profit a company generates above the return that shareholders are assumed to require, then capitalizes those excess profits into an estimate of value per share.
For Pinnacle Financial Partners, the starting point is an estimated Book Value of US$86.33 per share and a Stable EPS of US$11.50 per share, based on weighted future Return on Equity estimates from 11 analysts. The average Return on Equity used in the model is 10.96%, and the implied Cost of Equity is US$8.55 per share. That leaves an Excess Return of US$2.94 per share, which is treated as value created over and above the required shareholder return.
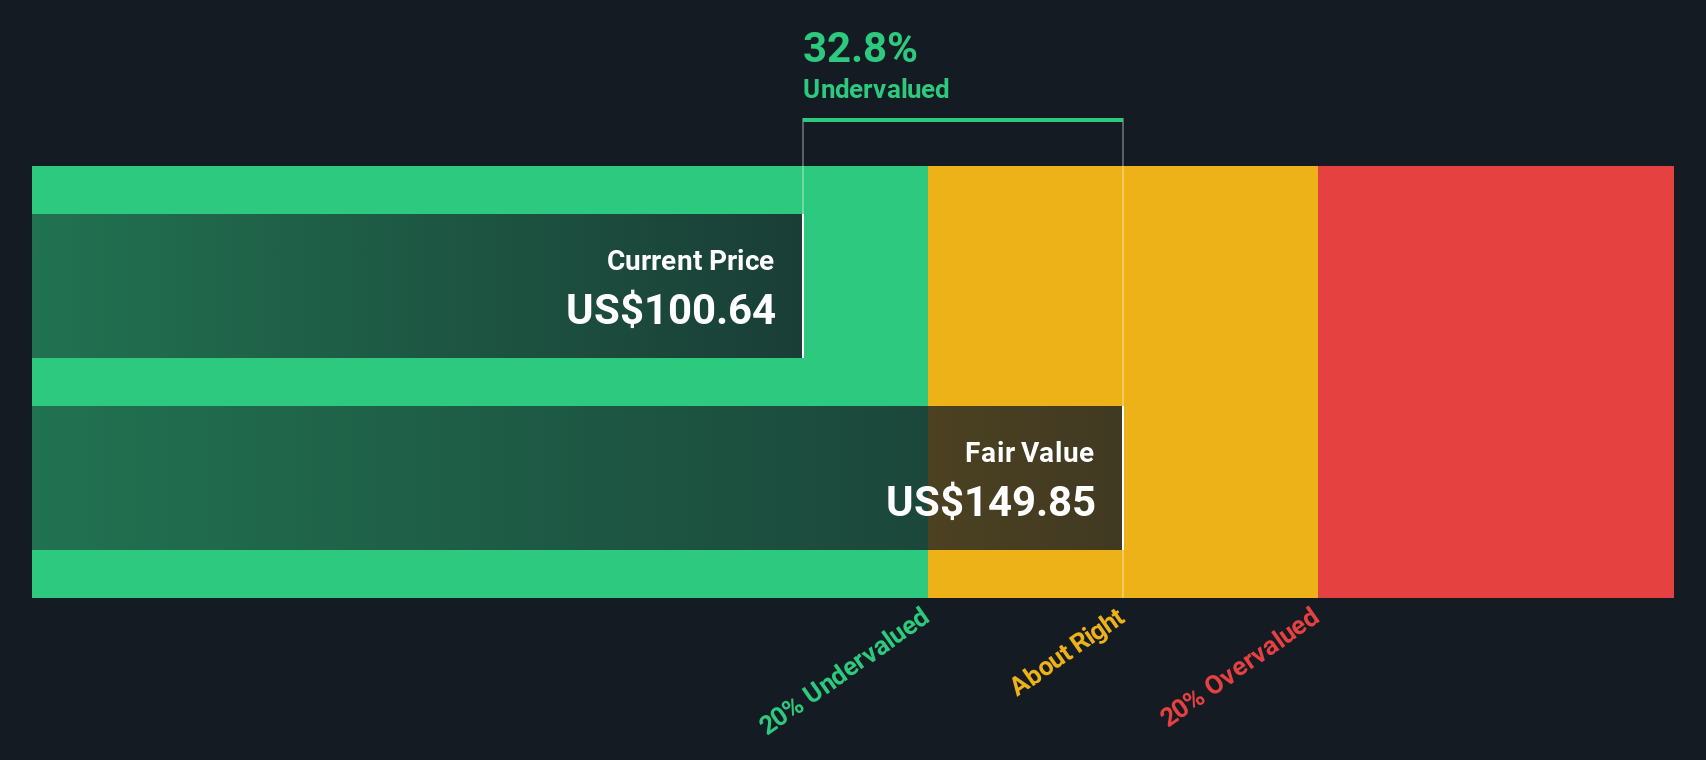
The model also incorporates a Stable Book Value of US$104.89 per share, sourced from weighted future Book Value estimates from 14 analysts, to reflect how the equity base may evolve over time. Putting these inputs together, the Excess Returns framework arrives at an intrinsic value of about US$165.03 per share.
Compared with the recent share price of US$95.21, this output suggests the stock appears about 42.3% undervalued on this measure.
Result: UNDERVALUED
Our Excess Returns analysis suggests Pinnacle Financial Partners is undervalued by 42.3%. Track this in your watchlist or portfolio, or discover 883 more undervalued stocks based on cash flows.
Approach 2: Pinnacle Financial Partners Price vs Earnings
For a profitable company like Pinnacle Financial Partners, the P/E ratio is a useful shorthand for what investors are currently willing to pay for each dollar of earnings. It ties the share price directly to earnings power, which is often a key anchor for bank valuations.
What counts as a “normal” or “fair” P/E ratio usually reflects two things: how fast earnings are expected to grow and how much risk investors see in those earnings. Higher growth or lower perceived risk can support a higher multiple, while slower growth or higher perceived risk can keep it closer to, or below, market norms.
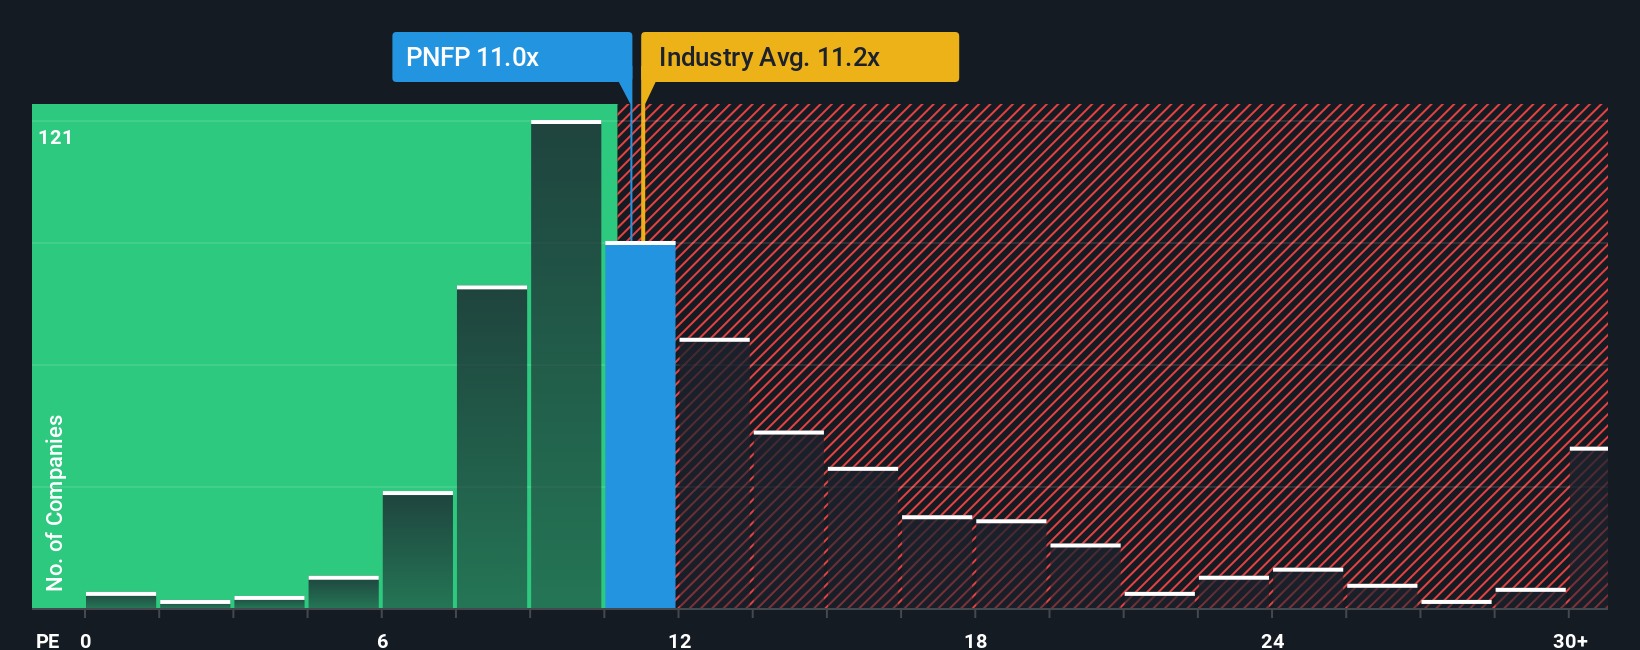
Pinnacle Financial Partners currently trades on a P/E of 12.04x. That sits slightly above the Banks industry average of about 11.85x, and below the peer average of 13.95x. Simply Wall St’s Fair Ratio for the stock is 25.59x. This Fair Ratio is a proprietary estimate of what the P/E could be, given factors such as earnings growth, profit margins, industry, market cap and specific risks. Because it is tailored to the company rather than just broad peer groups, it can give a more targeted reference point than simple comparisons to industry or peers. On this measure, Pinnacle Financial Partners screens as undervalued.
Result: UNDERVALUED
P/E ratios tell one story, but what if the real opportunity lies elsewhere? Discover 1442 companies where insiders are betting big on explosive growth.
Upgrade Your Decision Making: Choose your Pinnacle Financial Partners Narrative
Earlier we mentioned that there is an even better way to understand valuation, so let us introduce you to Narratives. These are simply your own story about a company linked directly to a set of numbers such as your fair value, and your expectations for future revenue, earnings and margins. All of this is brought together in an easy tool on Simply Wall St's Community page that helps you compare your Fair Value to the current price, see how other investors might set a higher Pinnacle Financial Partners value of about US$130 or a lower one of around US$95, and then watch those fair values update automatically as fresh news or earnings on Pinnacle Financial Partners come through.
Do you think there's more to the story for Pinnacle Financial Partners? Head over to our Community to see what others are saying!

This article by Simply Wall St is general in nature. We provide commentary based on historical data and analyst forecasts only using an unbiased methodology and our articles are not intended to be financial advice. It does not constitute a recommendation to buy or sell any stock, and does not take account of your objectives, or your financial situation. We aim to bring you long-term focused analysis driven by fundamental data. Note that our analysis may not factor in the latest price-sensitive company announcements or qualitative material. Simply Wall St has no position in any stocks mentioned.