Is REV Group (REVG) Pricing Reflect A 4.7% Pullback And Strong DCF Upside Potential
REV Group REVG | 0.00 |
- If you are wondering whether REV Group's current share price reflects its true worth, you are not alone. This article walks through what the market might be pricing in.
- The stock recently saw a 4.7% decline over the last 7 days, although it is still up 5.1% over 30 days and 2.6% year to date, with a very large 1 year return of 85.1% and an even larger gain over 5 years.
- Recent attention on REV Group has focused on how the business is positioned within capital goods and specialty vehicles, and how its order trends, contract wins, and backlog profile may influence investor expectations. News around these themes helps frame why the stock has moved sharply over the past year, and why some investors are reassessing the balance between risk and opportunity.
- On Simply Wall St's 6 point valuation checklist, REV Group scores a 2 out of 6, which suggests only a couple of checks currently point to undervaluation. Next we will look at what different valuation approaches say, before finishing with a broader way to think about what the stock could be worth.
REV Group scores just 2/6 on our valuation checks. See what other red flags we found in the full valuation breakdown.
Approach 1: REV Group Discounted Cash Flow (DCF) Analysis
A Discounted Cash Flow, or DCF, model estimates what a business could be worth by projecting its future cash flows and then discounting those back to today using a required return. It is essentially asking what those future cash flows are worth in your hands right now.
For REV Group, the model uses last twelve month Free Cash Flow of about $204.4 million as a starting point and applies a 2 Stage Free Cash Flow to Equity framework. Analysts provide explicit forecasts out to 2027, with Free Cash Flow for that year of $159.1 million. Beyond that, Simply Wall St extrapolates cash flows through 2035, with projected Free Cash Flow in 2035 of about $321.8 million, all in $ and then discounted back to today.
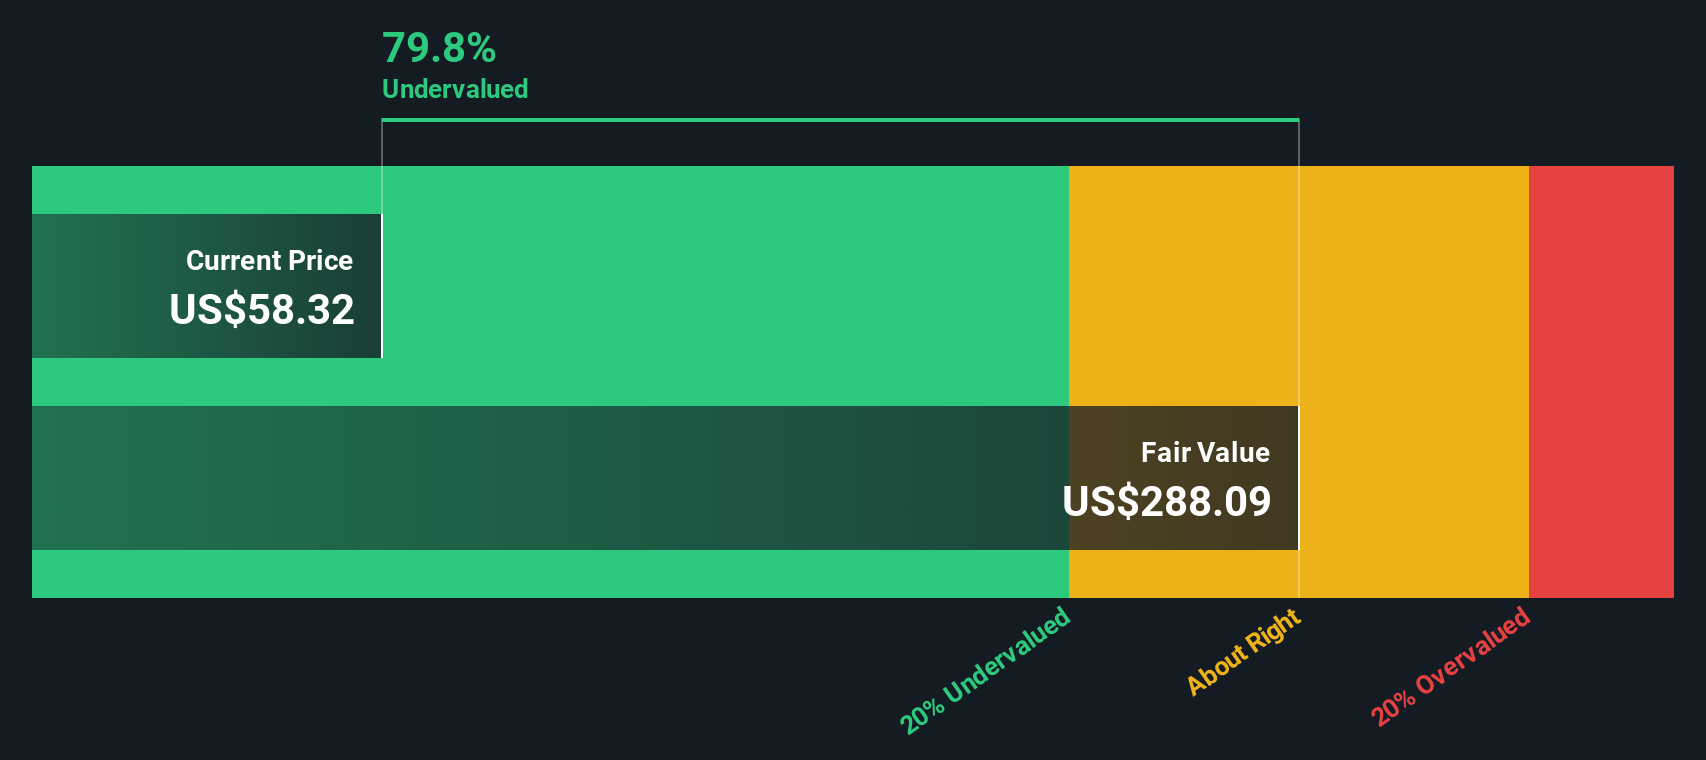
When these projected cash flows are added together and discounted, the DCF model arrives at an estimated intrinsic value of $89.26 per share. This implies the stock trades at a 28.4% discount to that estimate, so on this model alone it screens as undervalued.
Result: UNDERVALUED
Our Discounted Cash Flow (DCF) analysis suggests REV Group is undervalued by 28.4%. Track this in your watchlist or portfolio, or discover 870 more undervalued stocks based on cash flows.
Approach 2: REV Group Price vs Earnings
For a profitable company like REV Group, the P/E ratio is a useful way to gauge what investors are currently willing to pay for each dollar of earnings. It ties the share price directly to the business’s profit, which is what ultimately matters to equity holders.
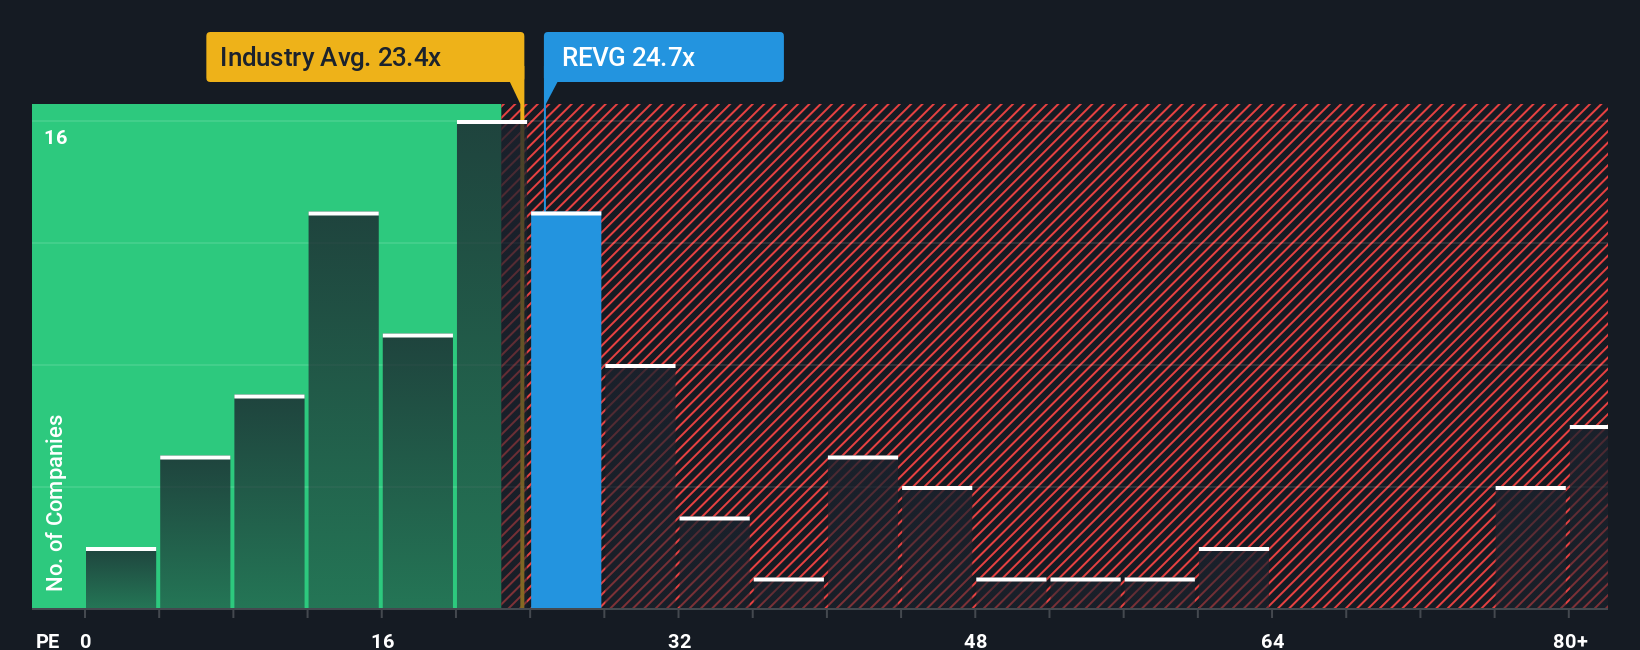
In general, higher growth expectations or lower perceived risk can support a higher, or “richer”, P/E ratio, while slower growth or higher risk tends to justify a lower multiple. REV Group currently trades on a P/E of 32.76x. That sits above the Machinery industry average of 27.72x and above the peer average of 19.59x, so at first glance it looks relatively expensive on this measure.
Simply Wall St’s Fair Ratio for REV Group is 30.79x. This is a proprietary estimate of what a reasonable P/E could be for the company, based on factors like its earnings growth profile, industry, profit margins, market cap and risk characteristics. Because it is tailored to the company, the Fair Ratio can be a more useful guide than a simple comparison with broad industry or peer averages. With the current P/E only modestly above the Fair Ratio, the stock screens as slightly overvalued on this metric.
Result: OVERVALUED
P/E ratios tell one story, but what if the real opportunity lies elsewhere? Discover 1418 companies where insiders are betting big on explosive growth.
Upgrade Your Decision Making: Choose your REV Group Narrative
Earlier we mentioned that there is an even better way to think about valuation, so let us introduce you to Narratives, which let you attach a clear story about REV Group to the numbers behind your fair value, like your assumptions for future revenue, earnings and margins.
A Narrative links what you believe about the business, such as its position in capital goods and specialty vehicles, to a set of forecasts, then connects that to a fair value you can compare with today’s share price to help you decide whether the stock looks attractive or not.
On Simply Wall St, Narratives sit in the Community page and are available to anyone as an easy tool. They update automatically when fresh news, earnings releases or other data points arrive, so your story, forecast and fair value do not go stale.
For REV Group, one investor might build a Narrative with a higher fair value that reflects strong confidence in future orders and margins. Another might set a much lower fair value based on more cautious expectations, and you can see both side by side against the current price.
Do you think there's more to the story for REV Group? Head over to our Community to see what others are saying!

This article by Simply Wall St is general in nature. We provide commentary based on historical data and analyst forecasts only using an unbiased methodology and our articles are not intended to be financial advice. It does not constitute a recommendation to buy or sell any stock, and does not take account of your objectives, or your financial situation. We aim to bring you long-term focused analysis driven by fundamental data. Note that our analysis may not factor in the latest price-sensitive company announcements or qualitative material. Simply Wall St has no position in any stocks mentioned.