
Please use a PC Browser to access Register-Tadawul
Get It
Is Rivian (RIVN) Pricing Reflect Its Potential After Recent Share Price Recovery
Rivian Automotive, Inc. Class A RIVN | 15.27 | -2.05% |
Rivian Automotive scores just 2/6 on our valuation checks. See what other red flags we found in the full valuation breakdown.
A Discounted Cash Flow, or DCF, model estimates what a company could be worth by projecting its future cash flows and then discounting those back to today in dollar terms.
For Rivian Automotive, the model used is a 2 Stage Free Cash Flow to Equity approach. The latest twelve month free cash flow (FCF) is a loss of about $442.1 million. Analyst and model projections in the coming years include both FCF losses and FCF turning positive, with a projected FCF of $1.8 billion in 2030. Only the earlier years come from analyst estimates, while the longer term is extrapolated by Simply Wall St.
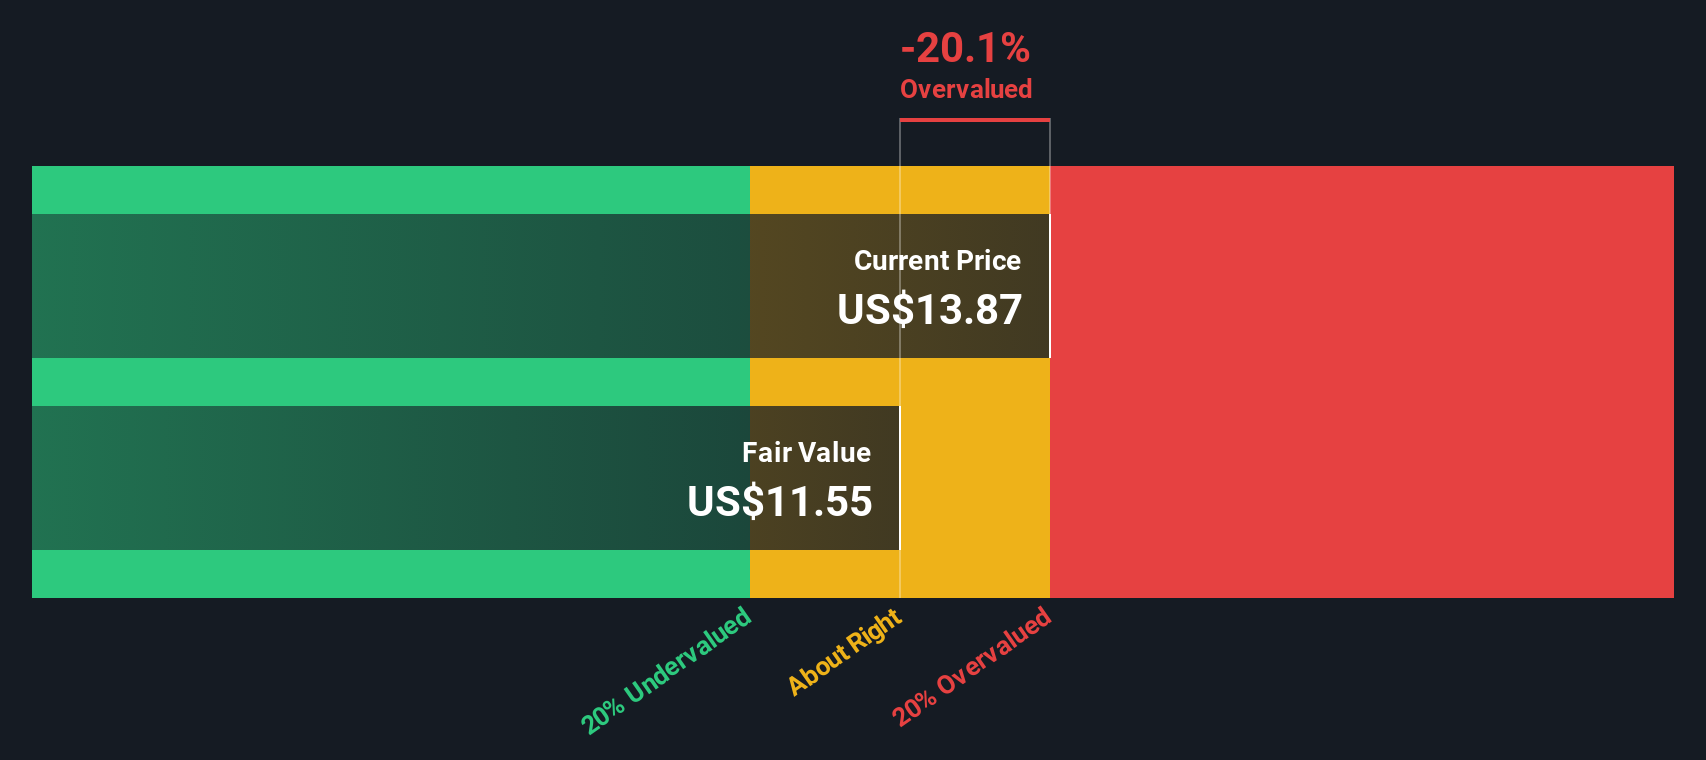
When all those projected cash flows are discounted back to today, the DCF model suggests an estimated intrinsic value of about $41.95 per share. Against the recent share price of $19.89, this DCF output implies the stock trades at a 52.6% discount. This points to a meaningful gap between the model value and the market price.
Result: UNDERVALUED
Our Discounted Cash Flow (DCF) analysis suggests Rivian Automotive is undervalued by 52.6%. Track this in your watchlist or portfolio, or discover 879 more undervalued stocks based on cash flows.
For companies that are still loss making or reinvesting heavily, P/S is often more useful than P/E because it compares the share price to revenue rather than earnings, which can be negative or volatile.
In general, higher growth expectations and lower perceived risk can support a higher P/S multiple. In contrast, slower growth and higher risk tend to justify a lower multiple. That is why it helps to compare a stock’s P/S with sensible benchmarks instead of looking at the number in isolation.
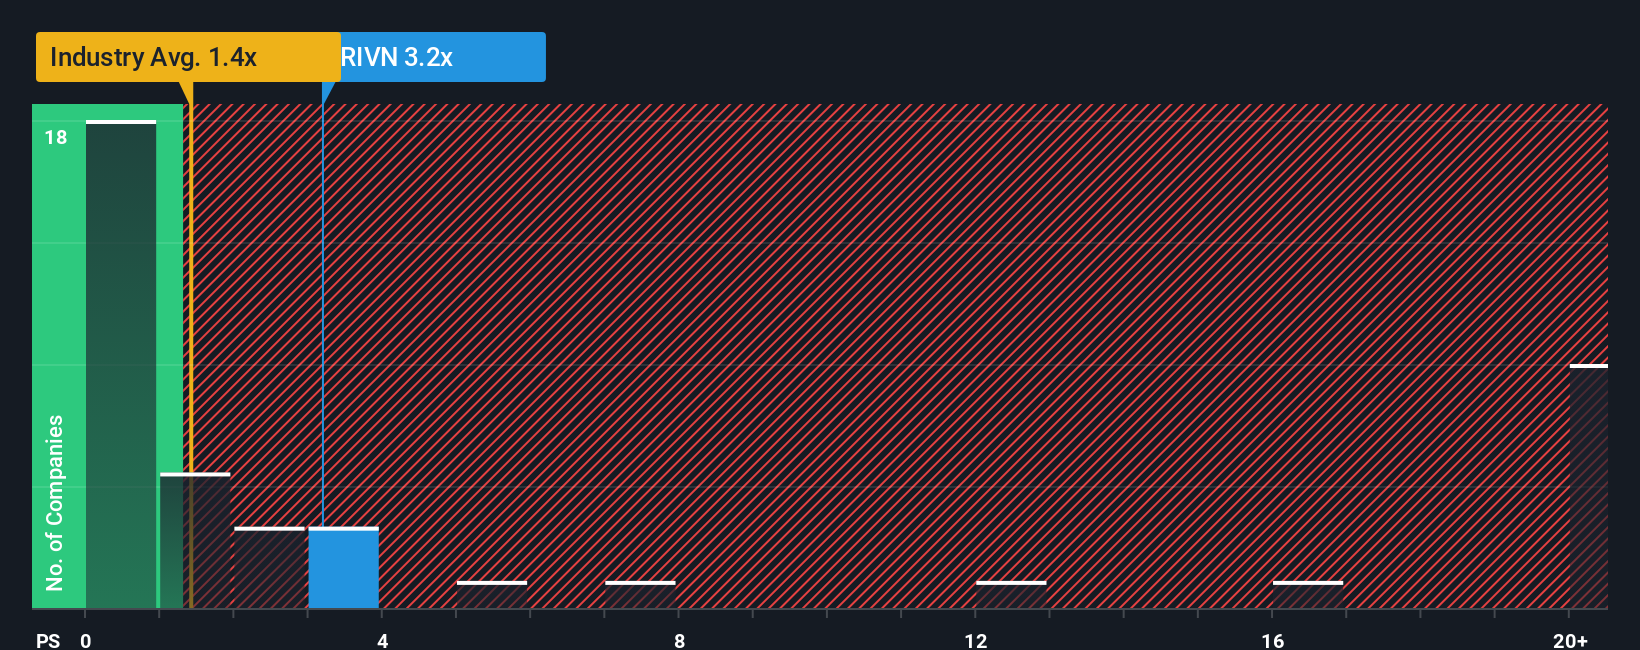
Rivian Automotive currently trades on a P/S ratio of about 4.18x. The Auto industry average P/S is about 0.64x, and the peer group we track sits around 1.08x. To add more context, Simply Wall St also calculates a Fair Ratio of 1.19x, which is the P/S multiple suggested by factors such as Rivian’s growth profile, margins, size and risk characteristics.
This Fair Ratio goes further than simple peer or industry comparisons because it tries to adjust for company specific traits like expected growth, profitability, market cap and business risks. Compared with the current P/S of 4.18x, the Fair Ratio of 1.19x suggests the shares trade at a richer multiple than those fundamentals imply.
Result: OVERVALUED
P/S ratios tell one story, but what if the real opportunity lies elsewhere? Discover 1444 companies where insiders are betting big on explosive growth.
Earlier we mentioned that there is an even better way to understand valuation. Narratives on Simply Wall St let you turn your view on Rivian Automotive into a clear story that links the business, a financial forecast and a fair value, then compares that fair value with the current price to help you decide what to do. It updates automatically as news or earnings arrive, and makes it easy to see why one investor might build a bullish Rivian view around R2, vertical integration and long term EV adoption with a higher fair value such as about US$21.00. Another investor might focus on expiring incentives, cash burn and competition and land closer to a cautious fair value such as about US$7.55. All of this is available within an accessible tool on the Community page that is already used by millions of investors.
Do you think there's more to the story for Rivian Automotive? Head over to our Community to see what others are saying!
This article by Simply Wall St is general in nature. We provide commentary based on historical data and analyst forecasts only using an unbiased methodology and our articles are not intended to be financial advice. It does not constitute a recommendation to buy or sell any stock, and does not take account of your objectives, or your financial situation. We aim to bring you long-term focused analysis driven by fundamental data. Note that our analysis may not factor in the latest price-sensitive company announcements or qualitative material. Simply Wall St has no position in any stocks mentioned.
