Is ServiceNow’s Recent Global Tech Collaboration Enough to Justify Its 2025 Valuation?
ServiceNow, Inc. NOW | 0.00 |
- Curious if ServiceNow is a bargain or overpriced? Let’s dig into what the numbers say before you make your next move.
- Shares have slipped by 3.5% over the past week and are down 20.7% year-to-date, a sharp contrast to the stock’s impressive 115.8% rise over the past three years.
- Recent headlines have focused on ServiceNow’s ongoing partnerships and expansion into new enterprise software markets. Some analysts see these developments as catalysts for future growth. Notably, the announcement of a major collaboration with a global technology giant caused ripples in investor sentiment amid a broad sector pullback.
- Currently, ServiceNow scores a 2 out of 6 on our valuation checks, suggesting some caution is warranted. However, the real story might be deeper than any single method suggests. Stay tuned as we break down the different valuation approaches and reveal a potentially smarter way to understand its true worth by the end of this article.
ServiceNow scores just 2/6 on our valuation checks. See what other red flags we found in the full valuation breakdown.
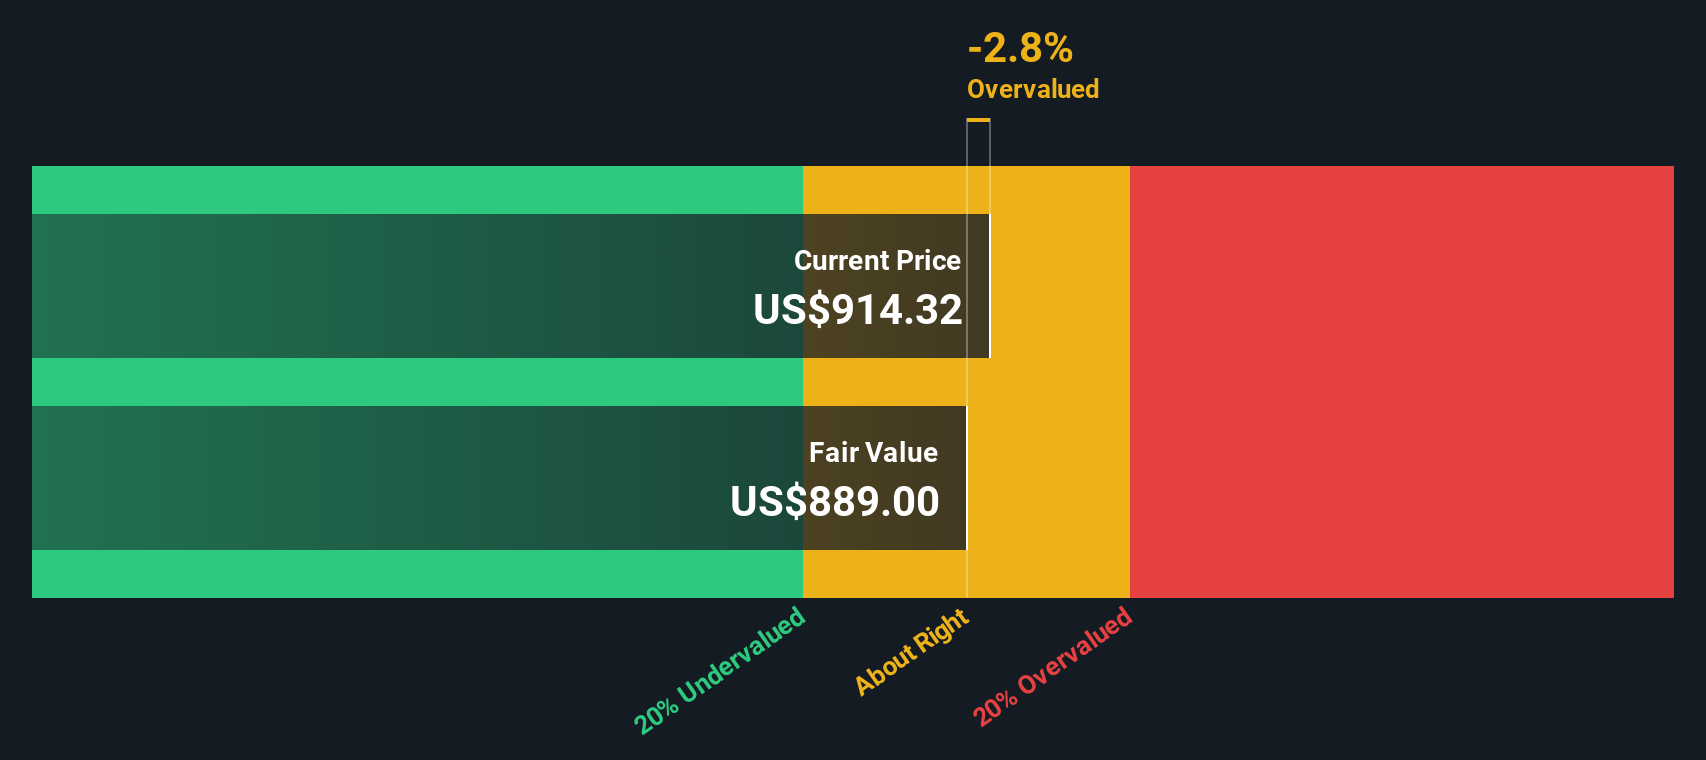
Approach 1: ServiceNow Discounted Cash Flow (DCF) Analysis
A Discounted Cash Flow (DCF) model estimates a business's true value by projecting its future cash flows and discounting them back to today's dollars. This approach is often used to assess whether a company's current share price accurately reflects its long-term earning potential.
For ServiceNow, the current free cash flow stands at approximately $3.88 billion, based on recent reports. Analysts expect this figure to continue growing, projecting free cash flow to reach around $9.41 billion by 2029. While analyst estimates typically span the next 5 years, projections beyond that are extrapolated by Simply Wall St using reasonable growth rates. All cash flows are measured in US dollars.
The DCF model used here suggests an estimated intrinsic value of $937.40 per share. This is about 10.8% higher than its current share price. According to this method, ServiceNow stock is undervalued. Such a discount implies investors may be getting in at an attractive price based on future cash flow expectations.
Result: UNDERVALUED
Our Discounted Cash Flow (DCF) analysis suggests ServiceNow is undervalued by 10.8%. Track this in your watchlist or portfolio, or discover 899 more undervalued stocks based on cash flows.
Approach 2: ServiceNow Price vs Earnings
For profitable companies like ServiceNow, the Price-to-Earnings (PE) ratio is a widely used valuation tool since it directly connects a company’s share price to its bottom-line earnings. Investors often turn to the PE ratio to gauge whether a stock is trading at a reasonable price compared to its power to generate profit.
It’s important to recognize that growth expectations and risk factors significantly influence what constitutes a “normal” or “fair” PE for a stock. Rapid earnings growth or a strong long-term outlook can justify a higher multiple, while greater risks, such as volatile revenue, might warrant a discount.
Currently, ServiceNow trades at a lofty 100.18x PE ratio. For context, its peers average about 56.11x, while the broader software industry typically trades around 31.22x. This may seem expensive at first glance, but these numbers tell only part of the story.
Enter Simply Wall St’s “Fair Ratio,” a custom metric that estimates what a justifiable PE should be for ServiceNow after accounting for its earnings growth, industry position, profit margin, market cap, and risk profile. Unlike simple benchmarks, this Fair Ratio gives a nuanced view and offers a tailored comparison that traditional peer or industry averages cannot provide.
For ServiceNow, the Fair Ratio is calculated at 49.76x, which is well below its current 100.18x. This substantial gap indicates that the stock may be trading at a significant premium compared to its fundamentals rather than being fairly priced against its unique characteristics.
Result: OVERVALUED
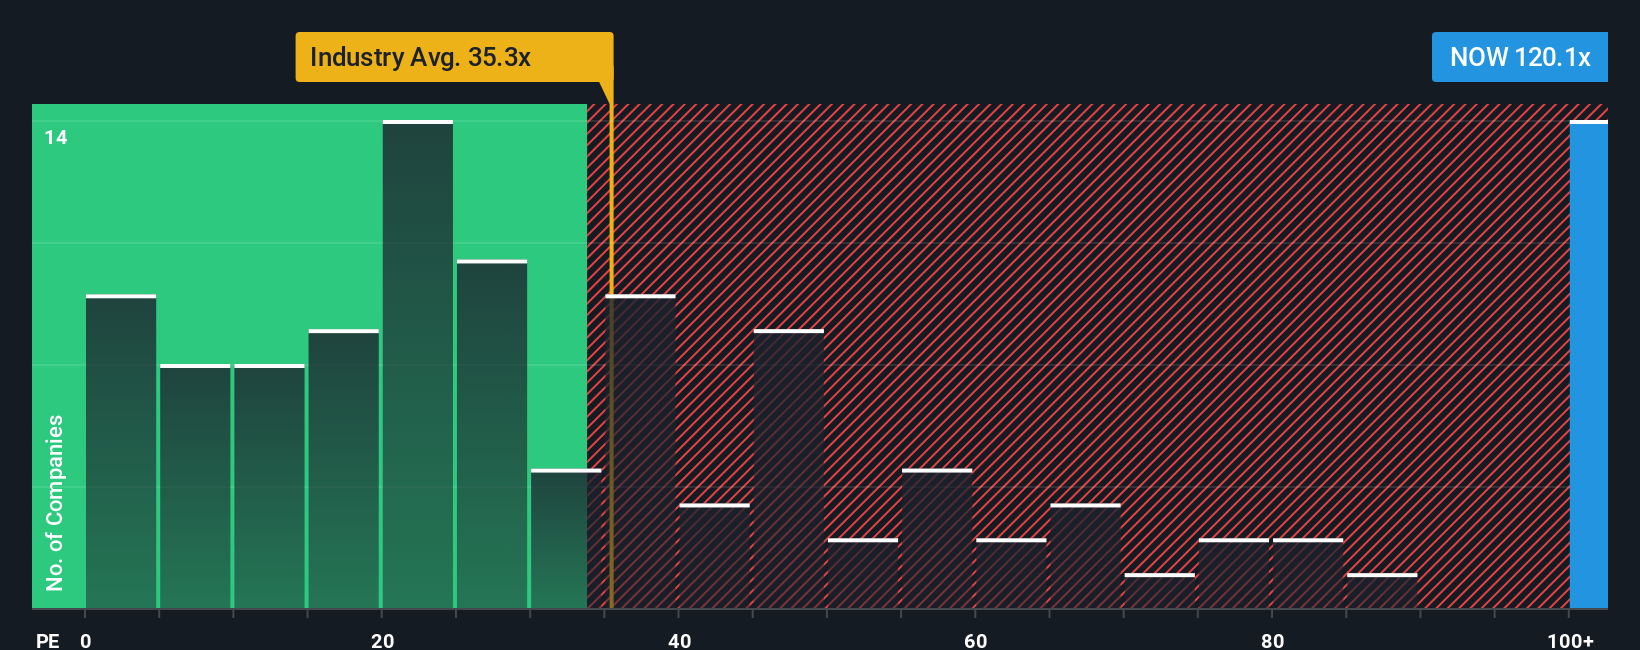
PE ratios tell one story, but what if the real opportunity lies elsewhere? Discover 1418 companies where insiders are betting big on explosive growth.
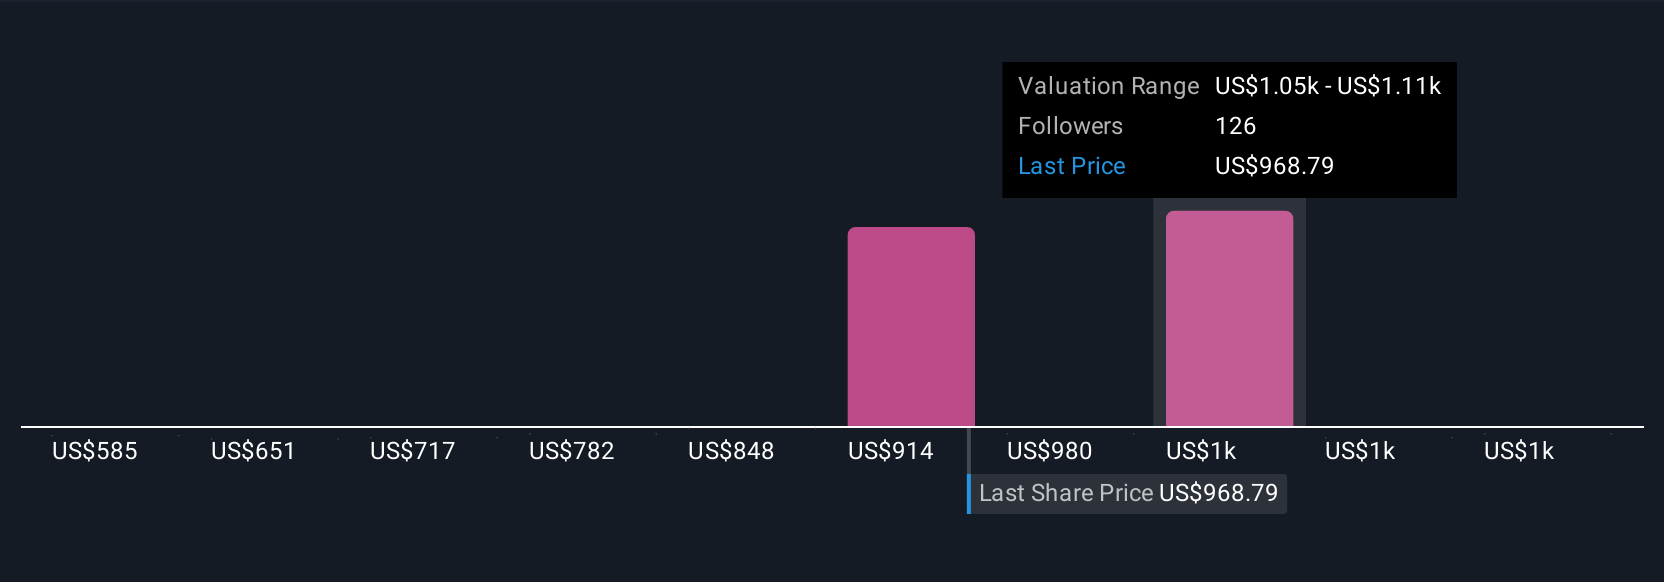
Upgrade Your Decision Making: Choose your ServiceNow Narrative
Earlier, we mentioned there is an even better way to understand valuation, so let's introduce you to Narratives. A Narrative is a simple, approachable tool that lets investors connect the story they believe about a company, such as their conviction on future revenue, profit margins, and risks, to a clear financial forecast and fair value estimate.
Unlike static ratios or generic analyst targets, Narratives allow you to put forward your own perspective and see how your assumptions shape ServiceNow’s fair value. This feature is easily accessible to everyone within Simply Wall St’s Community page, used by millions of investors, where you can explore, create, and discuss different Narratives in real time.
Narratives help you decide exactly when to buy or sell by making it seamless to compare each Narrative’s Fair Value to the current share price. Because the inputs and estimates update dynamically as new earnings reports or breaking news arrive, Narratives keep your analysis relevant and insightful without extra effort.
For example, some investors see ServiceNow’s fair value at just $904, reflecting a more cautious view of AI adoption and competitive risks, while others forecast as high as $1,243 by assuming bold revenue and margin expansion.
Do you think there's more to the story for ServiceNow? Head over to our Community to see what others are saying!
This article by Simply Wall St is general in nature. We provide commentary based on historical data and analyst forecasts only using an unbiased methodology and our articles are not intended to be financial advice. It does not constitute a recommendation to buy or sell any stock, and does not take account of your objectives, or your financial situation. We aim to bring you long-term focused analysis driven by fundamental data. Note that our analysis may not factor in the latest price-sensitive company announcements or qualitative material. Simply Wall St has no position in any stocks mentioned.