
Please use a PC Browser to access Register-Tadawul
Get It
Is Supernus Pharmaceuticals (SUPN) Still Attractive After A 30% One Year Share Price Gain
Supernus Pharmaceuticals, Inc. SUPN | 50.86 | -0.95% |
A Discounted Cash Flow, or DCF, model estimates what a company might be worth by projecting its future cash flows and then discounting those back to today using a required return. It is essentially asking what all those future dollars are worth in current terms.
For Supernus Pharmaceuticals, the model used is a 2 Stage Free Cash Flow to Equity approach, based on cash flows in $. The latest twelve month free cash flow sits at about $71.1 million. Analysts provide explicit forecasts out to 2030, with projected free cash flow of $473.5 million in that year, and Simply Wall St then extrapolates further annual figures out to 2035 using gradually moderating growth assumptions.
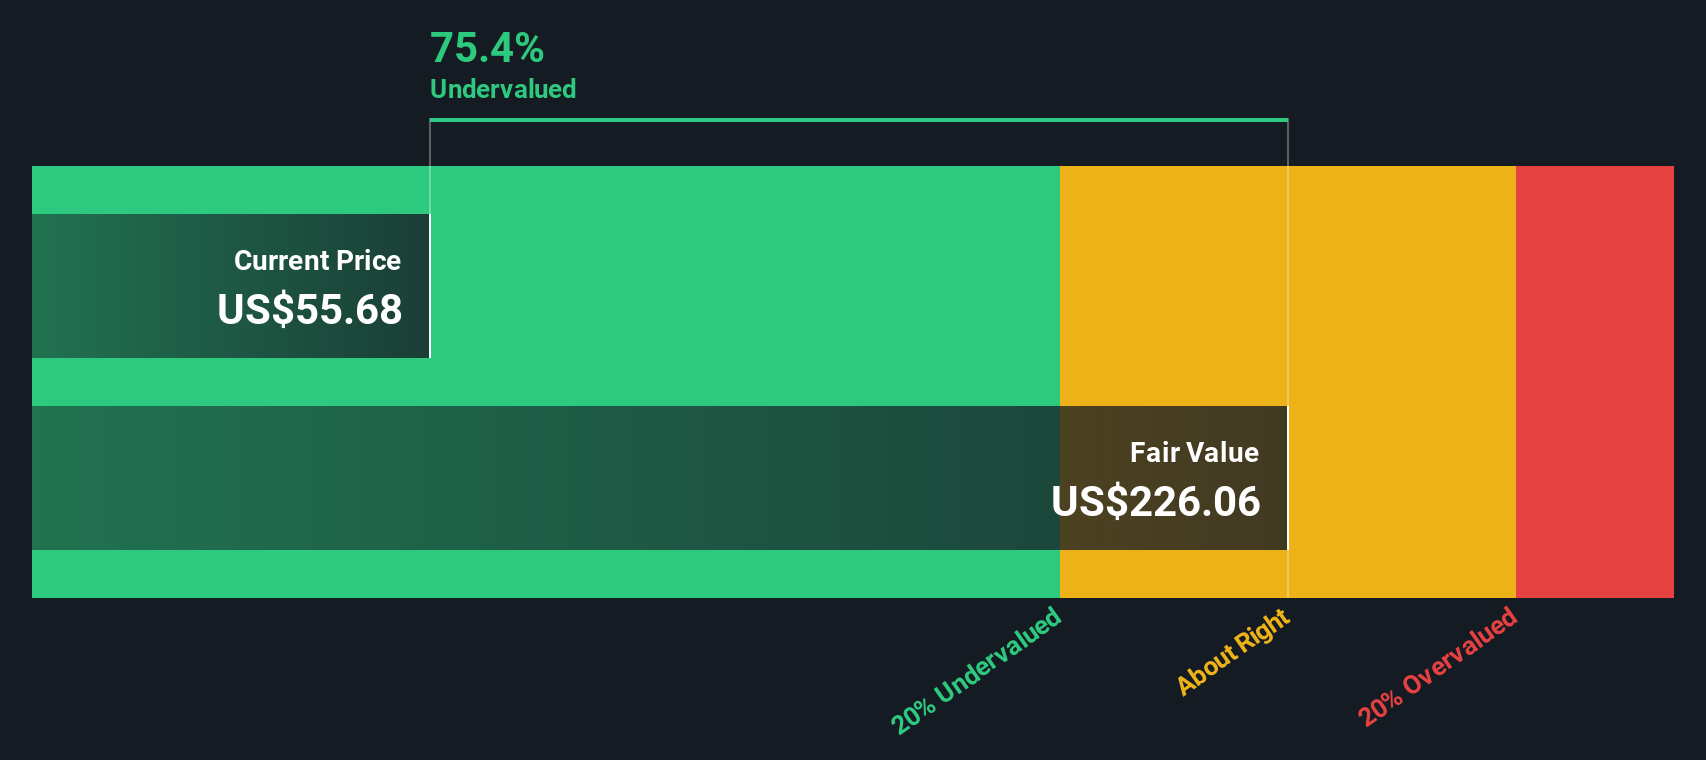
When those projected cash flows from 2026 through 2035 are discounted back, the DCF model arrives at an estimated intrinsic value of about $199.97 per share. Compared with the recent share price around $50.84, this output implies the stock is 74.6% undervalued according to this model.
Result: UNDERVALUED
Our Discounted Cash Flow (DCF) analysis suggests Supernus Pharmaceuticals is undervalued by 74.6%. Track this in your watchlist or portfolio, or discover 53 more high quality undervalued stocks.
For a company like Supernus Pharmaceuticals, where investors often focus on revenue potential and product pipeline, the P/S ratio is a useful way to think about what you are paying for each dollar of sales, especially when earnings can be influenced by one off items or heavy reinvestment.
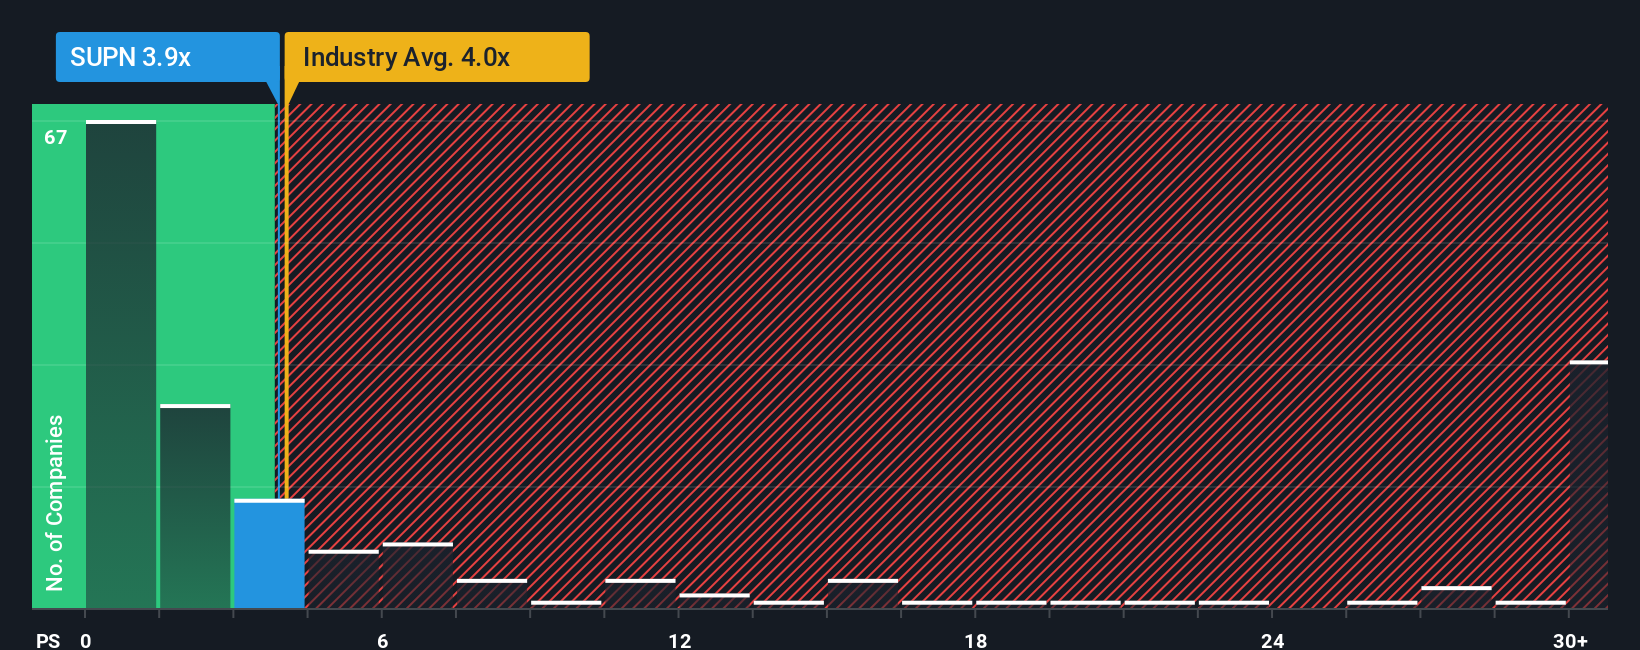
In general, higher growth expectations and lower perceived risk can support a higher “normal” P/S multiple, while slower growth or higher uncertainty usually justify a lower one. Today, Supernus Pharmaceuticals trades on a P/S of 4.28x. That sits close to the Pharmaceuticals industry average of 4.35x and well below the peer group average of 13.74x.
Simply Wall St’s Fair Ratio for Supernus Pharmaceuticals is 6.79x. This Fair Ratio is a proprietary estimate of what a reasonable P/S might be, given the company’s earnings growth profile, profit margins, size, industry and risk factors. Because it blends these company specific features, it can be more informative than a simple comparison with industry or peer averages, which may mix very different business models.
Set against the current P/S of 4.28x, the Fair Ratio of 6.79x suggests the shares trade below that modelled level.
Result: UNDERVALUED
P/S ratios tell one story, but what if the real opportunity lies elsewhere? Start investing in legacies, not executives. Discover our 23 top founder-led companies.
Earlier we mentioned that there is an even better way to think about value, and on Simply Wall St that starts with Narratives. With Narratives, you turn your view on Supernus Pharmaceuticals into a clear story that links its business drivers to a forecast for revenue, earnings and margins. This then leads into a Fair Value you can compare with today’s share price, all within an easy tool on the Community page. The tool updates as new news or earnings arrive and lets you see, for example, why one investor might build a more optimistic Narrative closer to the US$45.00 bullish target, while another leans toward a more cautious view closer to US$36.00. You can then see how each of those stories guides their decision about whether the current market price looks high, low or roughly in line with their expectations.
Do you think there's more to the story for Supernus Pharmaceuticals? Head over to our Community to see what others are saying!

This article by Simply Wall St is general in nature. We provide commentary based on historical data and analyst forecasts only using an unbiased methodology and our articles are not intended to be financial advice. It does not constitute a recommendation to buy or sell any stock, and does not take account of your objectives, or your financial situation. We aim to bring you long-term focused analysis driven by fundamental data. Note that our analysis may not factor in the latest price-sensitive company announcements or qualitative material. Simply Wall St has no position in any stocks mentioned.
