
Please use a PC Browser to access Register-Tadawul
Get It
Is There Now An Opportunity In Upbound Group (UPBD) After Recent Share Price Rebound
Upbound Group, Inc. UPBD | 19.31 | 0.00% |
A Discounted Cash Flow, or DCF, model estimates what a company might be worth by projecting its future cash flows and then discounting those back to today using a required rate of return. It is essentially asking what those future dollars are worth in today’s terms.
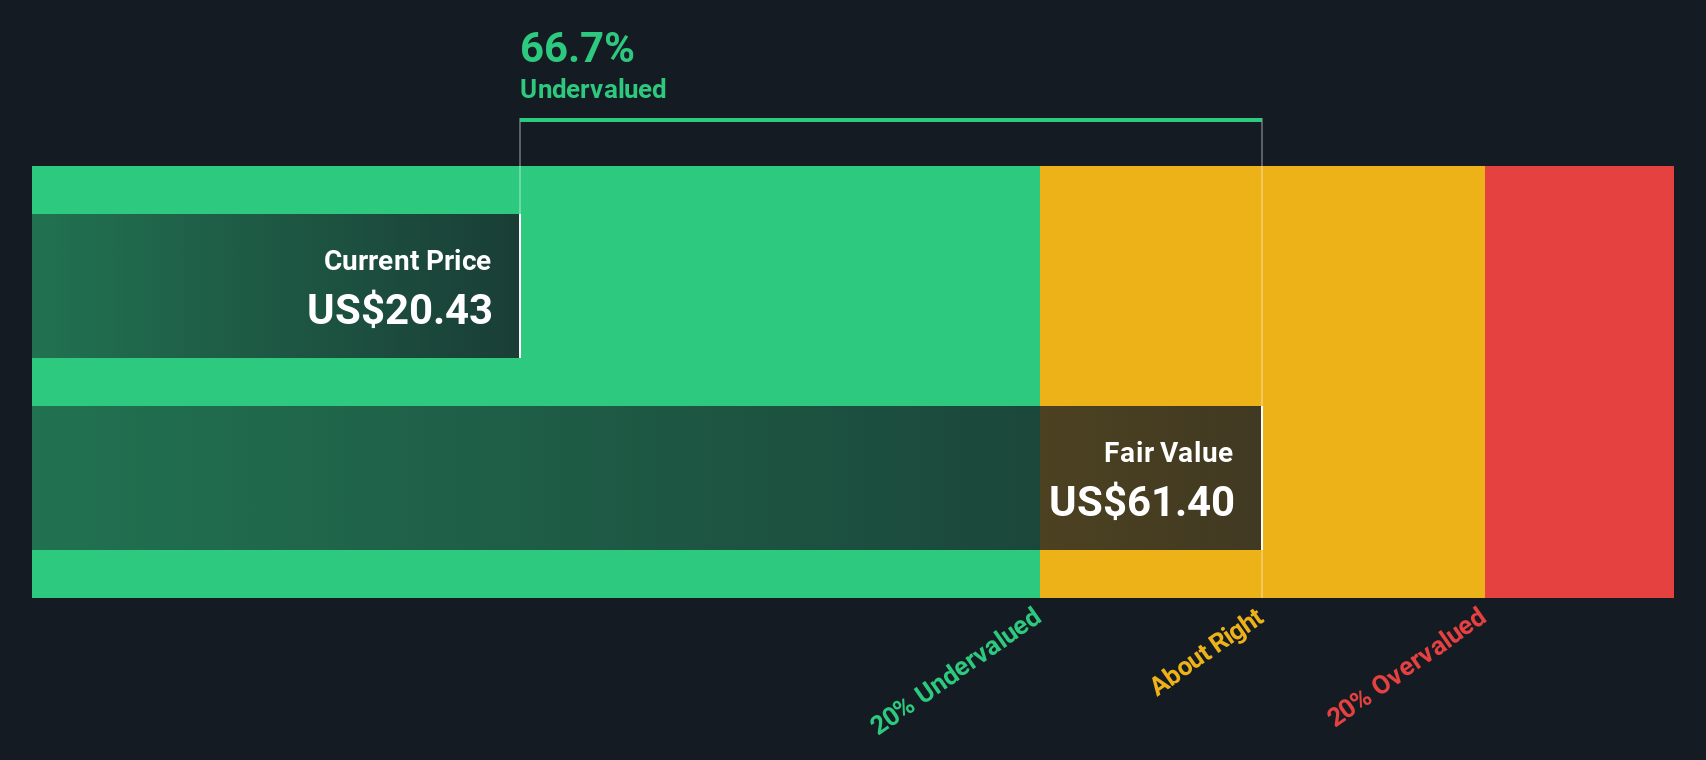
For Upbound Group, the model uses a 2 Stage Free Cash Flow to Equity approach based on cash flow projections in $. The latest twelve month free cash flow sits at about $140.9 million. Analyst inputs are provided out to 2029, with Simply Wall St extrapolating further projections out to 2035. By 2029, projected free cash flow is $336 million, and the extended ten year path runs from $209 million in 2026 to $455.2 million in 2035, with each year discounted back to reflect time and risk.
Adding these discounted cash flows together, the DCF model arrives at an estimated intrinsic value of about $58.69 per share, compared with the current share price of roughly $19.84. That implies the stock is 66.2% undervalued on this measure.
Result: UNDERVALUED
Our Discounted Cash Flow (DCF) analysis suggests Upbound Group is undervalued by 66.2%. Track this in your watchlist or portfolio, or discover 880 more undervalued stocks based on cash flows.
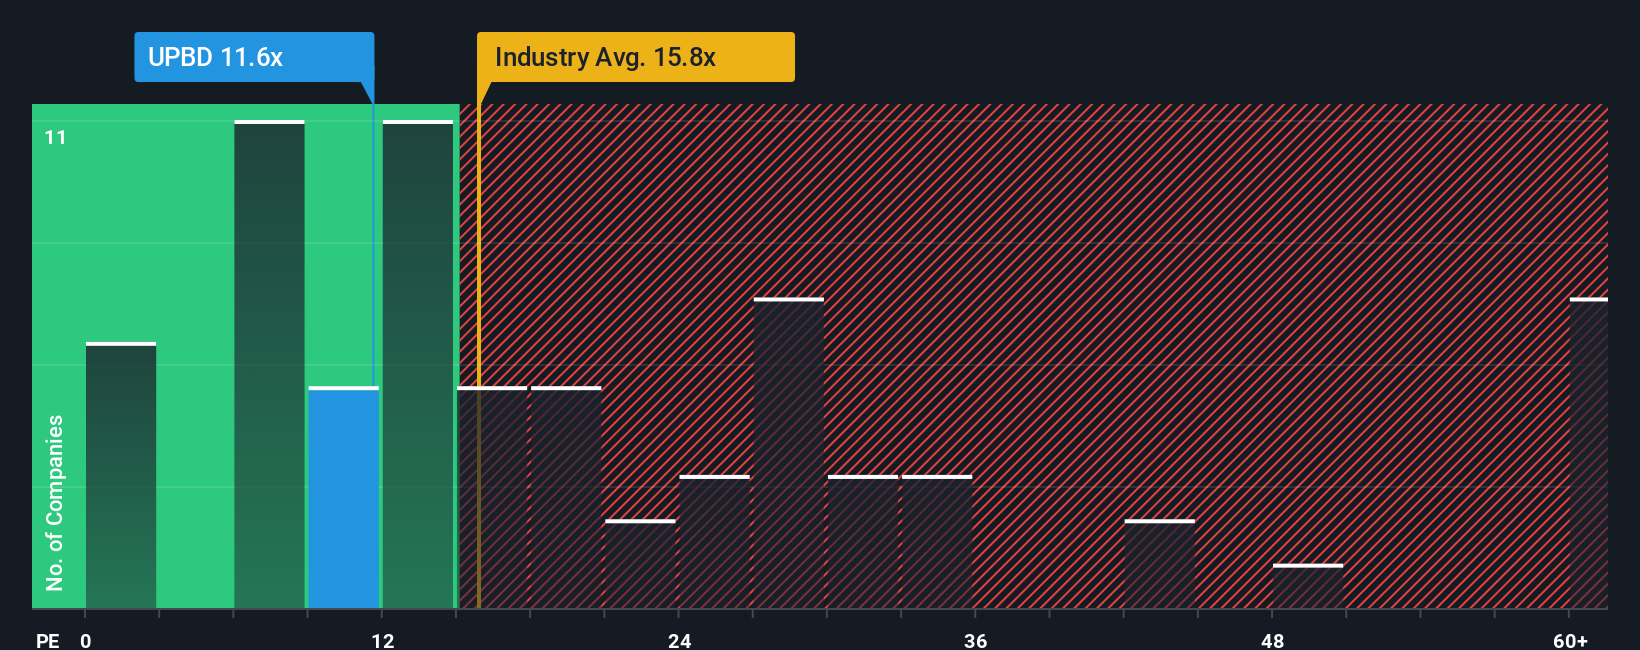
For profitable companies, the P/E ratio is a useful way to link what you are paying for the stock to the earnings the business is generating today. It gives you a quick sense of how many dollars investors are willing to pay for each dollar of current earnings.
What counts as a “normal” P/E depends heavily on how the market views a company’s earnings growth potential and risk. Higher expected growth and lower perceived risk usually support a higher P/E, while slower growth or higher risk tend to pull a fair P/E lower.
Upbound Group currently trades on a P/E of 13.60x. That sits below the Specialty Retail industry average of 21.01x and the peer average of 22.86x. Simply Wall St’s Fair Ratio for Upbound Group is 22.89x, which is an estimate of what its P/E might be given factors such as earnings growth, profit margins, industry, market cap and company specific risks.
The Fair Ratio is more tailored than a simple comparison with peers or the industry because it adjusts for the company’s own profile instead of assuming all retailers deserve the same multiple. Comparing 13.60x with the 22.89x Fair Ratio suggests the shares are trading below this model based estimate.
Result: UNDERVALUED
P/E ratios tell one story, but what if the real opportunity lies elsewhere? Discover 1446 companies where insiders are betting big on explosive growth.
Earlier we mentioned that there is an even better way to understand valuation. Let us introduce you to Narratives, which let you attach a clear story about Upbound Group’s future revenue, earnings and margins to your own fair value estimate. You can update that story automatically when news or earnings arrive, and then compare your Fair Value with the current price, all within Simply Wall St’s Community page that is used by millions of investors. For example, one investor might focus on growth drivers like Acima credit products and arrive at a higher fair value such as about US$50 per share. Another investor might be more cautious about risks like legal challenges or credit quality and land closer to the lower end around US$33, with both perspectives expressed as concrete forecasts rather than just opinions.
Do you think there's more to the story for Upbound Group? Head over to our Community to see what others are saying!

This article by Simply Wall St is general in nature. We provide commentary based on historical data and analyst forecasts only using an unbiased methodology and our articles are not intended to be financial advice. It does not constitute a recommendation to buy or sell any stock, and does not take account of your objectives, or your financial situation. We aim to bring you long-term focused analysis driven by fundamental data. Note that our analysis may not factor in the latest price-sensitive company announcements or qualitative material. Simply Wall St has no position in any stocks mentioned.
