
Please use a PC Browser to access Register-Tadawul
Get It
Is There Opportunity in Under Armour After Five-Year Decline and Recent Earnings Disappointment?
Under Armour, Inc. Class A UAA | 4.33 | -2.04% |
If you have Under Armour on your radar, you are likely weighing whether now is a good moment to buy, sell, or simply wait things out. The stock has seen better days, but its recent moves tell a nuanced story. Over the past week, shares have inched up by 2.0%, a welcome change of pace considering the longer-term declines. Zoom out and the picture shifts, with losses of 6.2% over the past month, a substantial drop of 37.0% year-to-date, and a staggering 56.5% decline over five years. These swings have caught the eye of many investors who follow athletic apparel stocks and track broader shifts in consumer spending or competition.
So, is Under Armour undervalued after these setbacks, or is there more risk ahead than meets the eye? According to our valuation scorecard, the company checks the box for just 1 out of 6 undervaluation measures, suggesting that even after a steep fall, true bargains may be elusive here. But how does this score actually stack up, and what can it really tell you about where Under Armour stands on the value spectrum?
Let’s break down the different valuation approaches used to size up the company, and then, stick around for an even clearer way to make sense of what Under Armour is really worth.
Under Armour scores just 1/6 on our valuation checks. See what other red flags we found in the full valuation breakdown.The Discounted Cash Flow (DCF) model estimates a company's intrinsic value by projecting its future free cash flows and then discounting those cash flows back to today, reflecting both time and risk. For Under Armour, this approach uses a two-stage Free Cash Flow to Equity method, focusing on how much cash the company actually generates and could theoretically return to shareholders after expenses and investments.
Currently, Under Armour is posting a negative Free Cash Flow of $310.7 million, meaning the business is using more cash than it is producing. Analyst projections indicate that the company could turn this around, reaching a projected Free Cash Flow of $75 million by 2030. The estimates show some volatility, while losses are expected to continue in the short term, gradual growth is forecast further out, with Simply Wall St extrapolating beyond what analysts estimate directly.
Despite these future growth hopes, the DCF model puts Under Armour’s fair value at just $1.56 per share. Compared to the current price, this suggests the stock is actually 226.6% overvalued, a significant premium to what the company’s future cash generation might justify.
Result: OVERVALUED
Head to the Valuation section of our Company Report for more details on how we arrive at this Fair Value for Under Armour.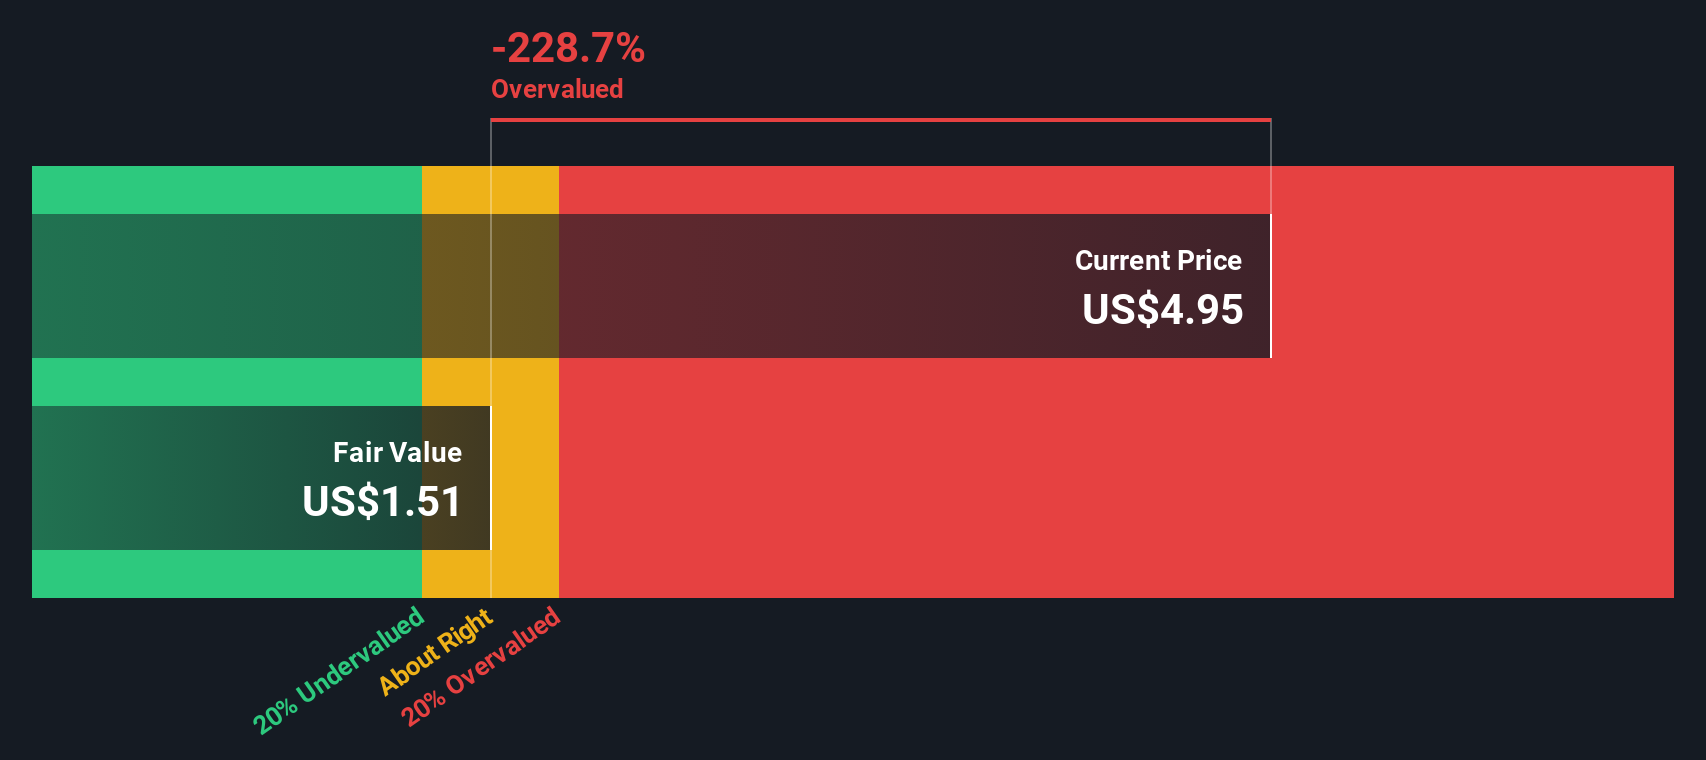
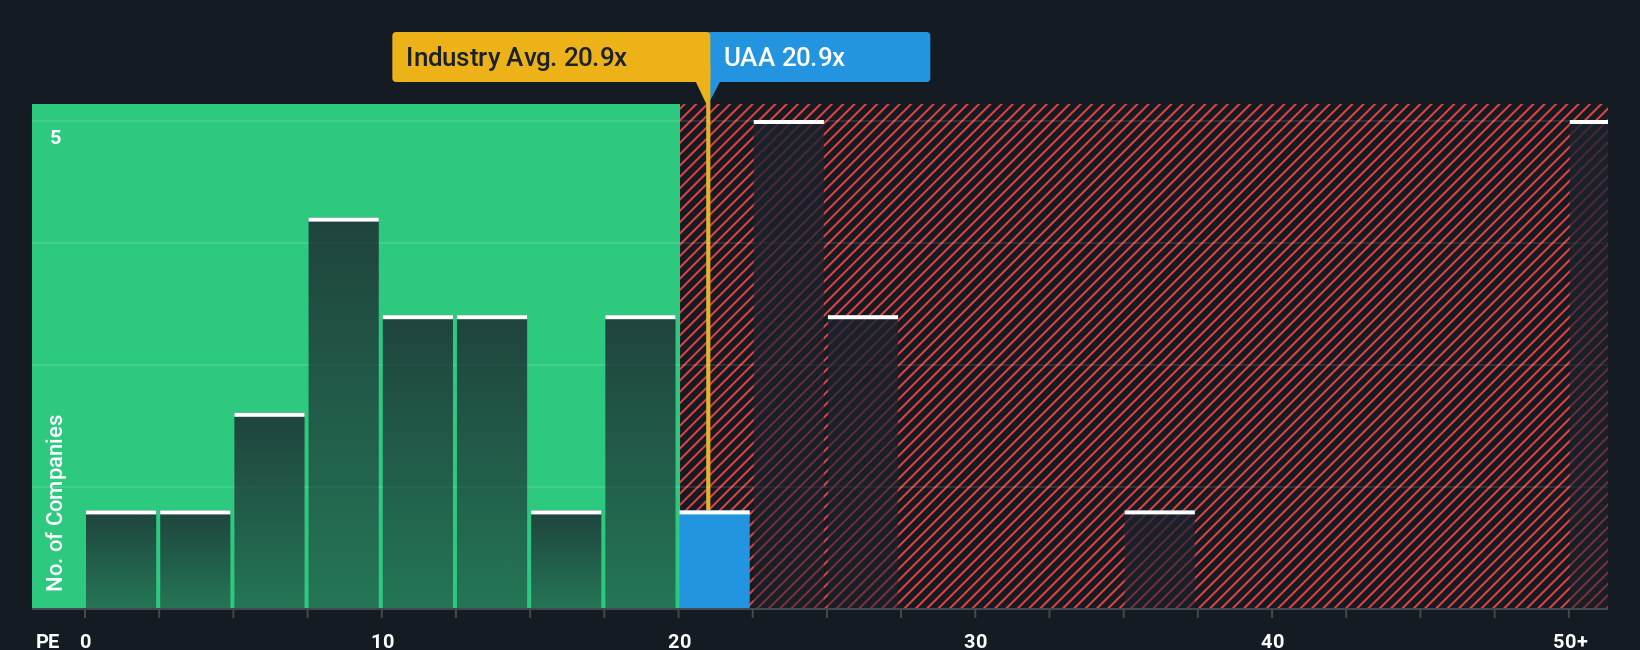
The price-to-earnings (PE) ratio is one of the most accepted ways to value profitable companies like Under Armour because it quickly reflects how much investors are willing to pay for each dollar of current earnings. Generally, a higher PE is justified for companies expected to deliver robust growth or that are seen as less risky, while a lower PE is typical for slower growth or riskier businesses. It is important, however, to look at this metric in the context of similar companies and industry standards.
Under Armour currently trades at a PE ratio of 21.5x, which is above its peer average of 13.5x and marginally higher than the industry average of 20.3x. This suggests that, at face value, investors are expecting slightly more from Under Armour compared to other luxury industry stocks. However, price multiples alone do not tell the whole story. Simply Wall St's "Fair Ratio" provides further insight. For Under Armour, the Fair Ratio is calculated at 26.2x. This proprietary metric factors in growth prospects, risk, profit margins, company size, and relevant industry characteristics.
By combining these crucial elements, the Fair Ratio offers a more tailored view than simply comparing to peers or the broad industry, as it recognizes the unique qualities and outlook of Under Armour. In this case, Under Armour’s actual PE ratio is a bit below its Fair Ratio, indicating the stock is trading slightly under expectations set by its specific attributes.
Result: UNDERVALUED
Earlier, we mentioned there is an even better way to understand valuation, so let's introduce you to Narratives. A Narrative is your personal, data-driven story about a company, where you lay out your view on its future revenue, earnings, margins, and ultimately its fair value, connecting the bigger picture to the financial numbers.
Narratives link Under Armour's current situation, such as its brand shifts, challenges, and opportunities, directly to a financial forecast, making your thinking both visible and actionable. This powerful tool is easy to use and is freely available on Simply Wall St's platform within the Community page, already used by millions of investors to clarify their thinking and compare perspectives.
With Narratives, you can swiftly see whether your view (Fair Value) suggests the stock is a bargain or overpriced relative to today’s price, helping you decide when to buy or sell. In addition, Narratives automatically update with new developments, so your investment thesis stays fresh and evidence-based.
For example, some investors believe Under Armour could be worth $13.80 if its brand transformation succeeds and global expansion pays off. Others see risks weighing it down to $4.00, making it easy to see how your view stacks up and why the story behind the numbers matters.
Do you think there's more to the story for Under Armour? Create your own Narrative to let the Community know!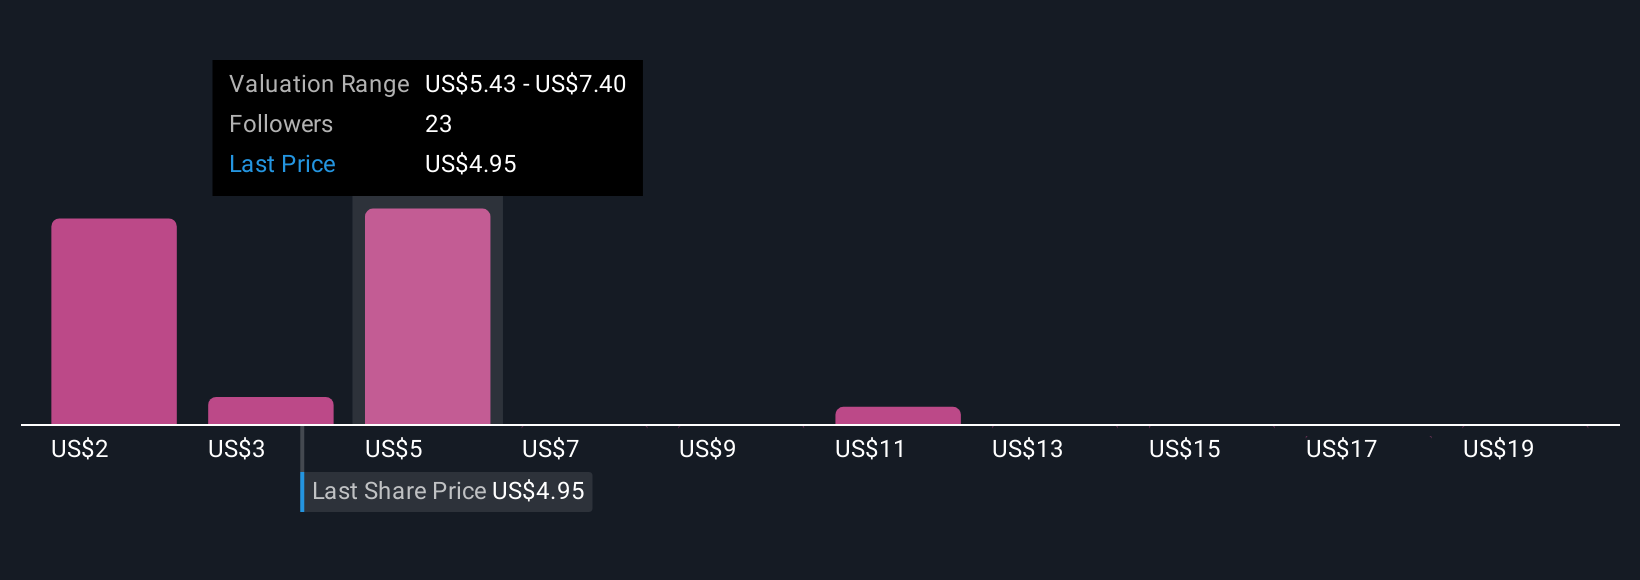
This article by Simply Wall St is general in nature. We provide commentary based on historical data and analyst forecasts only using an unbiased methodology and our articles are not intended to be financial advice. It does not constitute a recommendation to buy or sell any stock, and does not take account of your objectives, or your financial situation. We aim to bring you long-term focused analysis driven by fundamental data. Note that our analysis may not factor in the latest price-sensitive company announcements or qualitative material. Simply Wall St has no position in any stocks mentioned.
