Is There Still Room for CoreWeave After Its 200% Rally in 2025?
CoreWeave CRWV | 0.00 |
If you are watching CoreWeave and wondering whether to buy, sell, or simply hold, you are certainly not alone. The past month has been nothing short of a rollercoaster for the stock. After a sharp 24.2% surge over the last 30 days, followed by a recent 3.6% dip in the past week, CoreWeave has caught the eye of many investors trying to decode its next move. Year to date, the stock’s trajectory is even more astonishing, up a jaw-dropping 200.9% and positioning itself among the market’s top performers.
What is driving all this activity? Unlike some of its peers, CoreWeave has been affected by a broader surge in demand for high-performance cloud infrastructure, fueled in part by industry shifts and evolving AI workloads. While news flow about the company has not always resulted in immediate price swings, it has helped signal to investors that CoreWeave is a player to watch in the competitive technology landscape.
With so much volatility, it makes sense to ask how CoreWeave is valued right now. According to our standard six-point undervaluation checklist, it scores a solid 4, signaling the company is undervalued in four out of six major categories. Of course, numbers only tell part of the story. Let’s break down these valuation approaches and, at the end, explore an even more insightful way to judge whether CoreWeave really deserves a spot in your portfolio.
CoreWeave delivered 0.0% returns over the last year. See how this stacks up to the rest of the IT industry.Approach 1: CoreWeave Discounted Cash Flow (DCF) Analysis
The Discounted Cash Flow (DCF) model estimates a company’s value by projecting its future cash flows and then discounting these figures back to today’s dollars. This approach helps investors weigh what a company’s potential future returns are worth now, based on its likely ability to generate cash.
For CoreWeave, the latest reported Free Cash Flow (FCF) stands at negative $11.15 Billion, reflecting a phase of heavy investment and growth. Analysts expect this to turn positive by 2029, forecasting an FCF of $2.85 Billion. Since estimates from analysts only extend out five years, Simply Wall St extrapolates further by projecting continued growth in annual FCF through 2035, where a figure of $13.74 Billion is estimated. These numbers are discounted back based on today’s cost of capital to arrive at the company’s DCF intrinsic value.
This analysis results in a fair value estimate of $205.50 per share for CoreWeave. Compared to the current market price, the DCF model implies the stock is trading at a 41.4% discount. This suggests substantial undervaluation at the present time.
Result: UNDERVALUED
Head to the Valuation section of our Company Report for more details on how we arrive at this Fair Value for CoreWeave.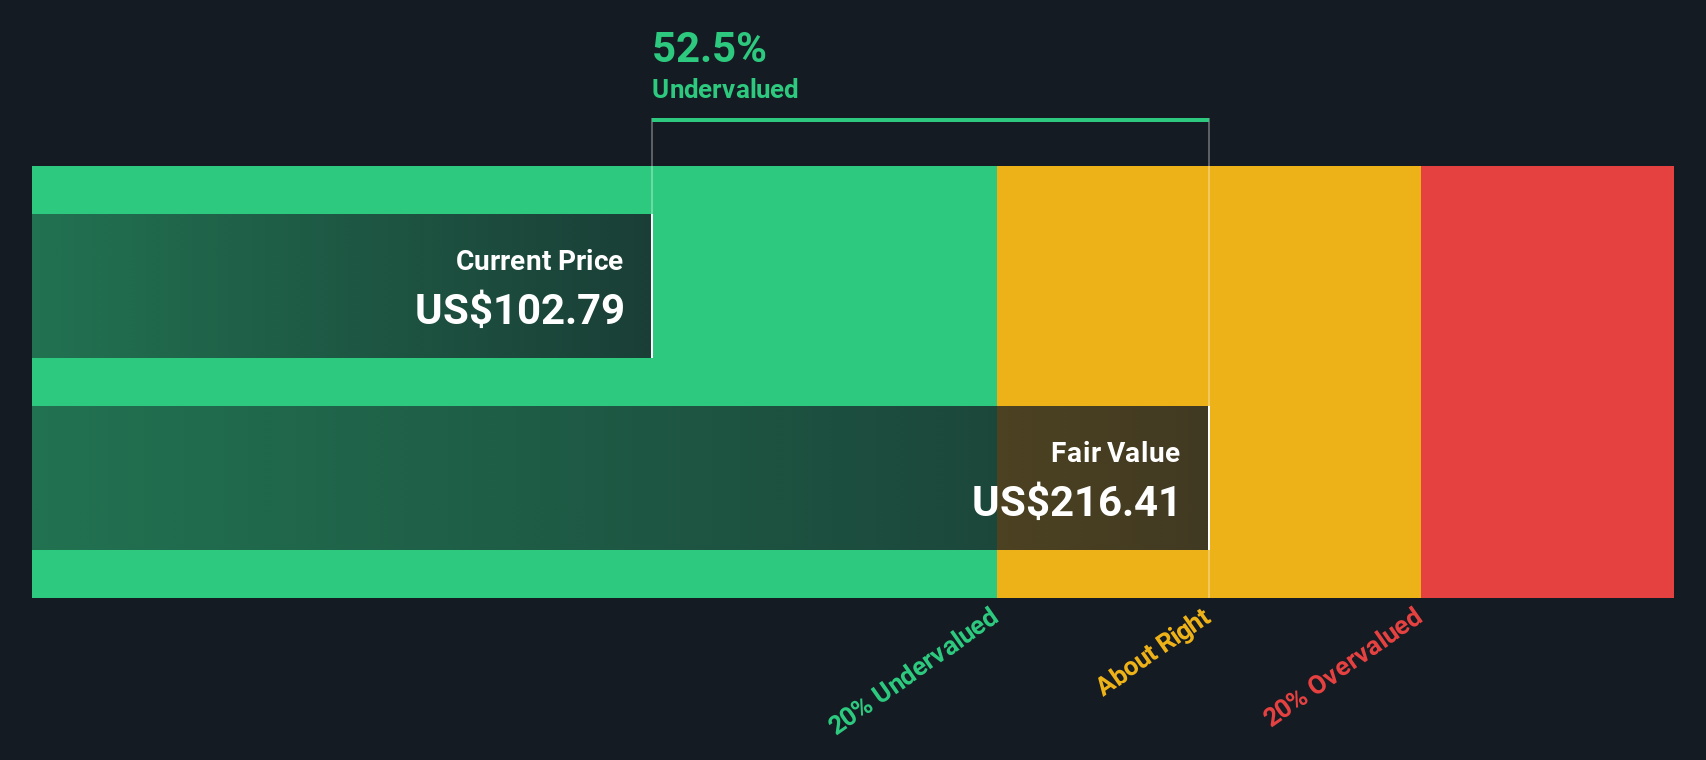
Approach 2: CoreWeave Price vs Sales
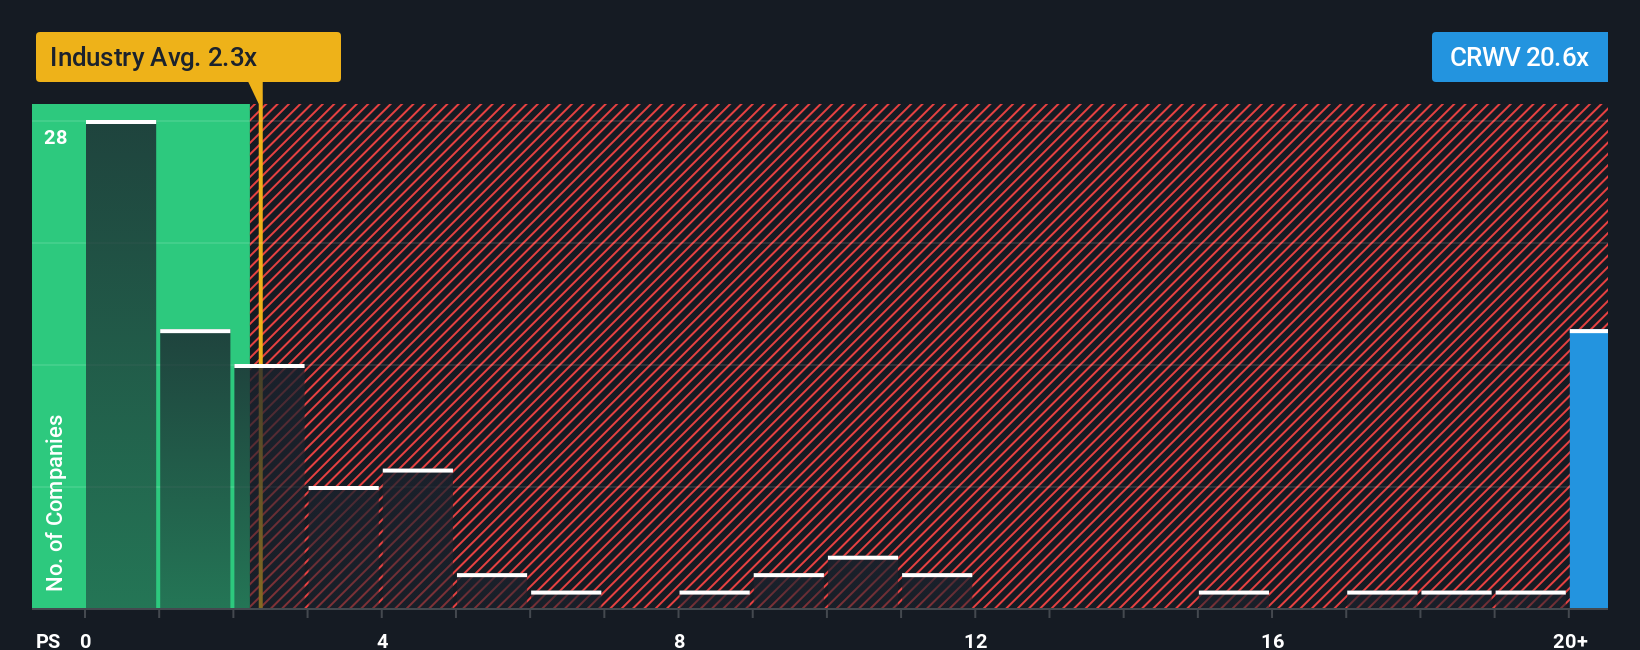
For high-growth technology companies like CoreWeave that have not yet achieved consistent profitability, the Price-to-Sales (P/S) ratio is often the most relevant valuation metric. The P/S ratio allows investors to understand how much they are paying for each dollar of the company’s sales, which is especially useful before sustained earnings are established.
Generally, the "right" P/S ratio should account for growth rates, profit margins, and the unique risks of a business. Higher growth, sizable market opportunities, or lower risk typically warrant a higher ratio. Conversely, slower growth or greater uncertainty justify a lower multiple. Comparing a company’s P/S to the industry average or peer benchmarks gives some context for how the market is currently pricing comparable opportunities.
CoreWeave currently trades at a P/S ratio of 17.7x. This is significantly above the IT industry average of 2.7x and also below the peer average of 21.7x. However, Simply Wall St's proprietary "Fair Ratio" goes a step further by tailoring the multiple based on CoreWeave’s expected growth, industry dynamics, profitability prospects, market cap, and unique risks. This more sophisticated approach assigns a Fair Ratio of 49.8x. Given CoreWeave’s characteristics, the current valuation looks conservative according to this metric.
Unlike simple comparisons with peers or the sector, the Fair Ratio provides a fuller picture by accounting for all relevant financial and business factors. This makes it a more reliable benchmark.
Comparing the actual P/S to CoreWeave’s Fair Ratio suggests the stock is attractively priced relative to its underlying potential.
Result: UNDERVALUED
Upgrade Your Decision Making: Choose your CoreWeave Narrative
Earlier we mentioned that there is an even better way to understand valuation, so let’s introduce you to Narratives. A Narrative is a user-created story behind the numbers, where you outline your assumptions about a company’s future revenue, earnings, and fair value. Narratives bridge the gap between a company’s story and its financial forecast, ultimately connecting these insights to a fair value estimate.
Narratives are easy to create and update, and can be accessed by anyone on Simply Wall St’s Community page, used by millions of investors worldwide. They help you make smarter decisions by clearly showing when a stock appears overvalued or undervalued, using the difference between Fair Value and the current price as your signal to buy or sell. Narratives are dynamic too, refreshing automatically to reflect the latest news or earnings releases so your view is always up to date.
For CoreWeave, for example, some investors currently project a very bullish future fair value, while others see much more moderate potential, all based on their unique perspectives. With Narratives, it becomes simple to apply your own view as the company’s story unfolds and respond intelligently to new developments.
Do you think there's more to the story for CoreWeave? Create your own Narrative to let the Community know!
This article by Simply Wall St is general in nature. We provide commentary based on historical data and analyst forecasts only using an unbiased methodology and our articles are not intended to be financial advice. It does not constitute a recommendation to buy or sell any stock, and does not take account of your objectives, or your financial situation. We aim to bring you long-term focused analysis driven by fundamental data. Note that our analysis may not factor in the latest price-sensitive company announcements or qualitative material. Simply Wall St has no position in any stocks mentioned.