Is Twilio (TWLO) Pricing Reflect Its Repositioning And Recent Share Price Swings
Twilio, Inc. Class A TWLO | 132.56 | +0.78% |
- If you are wondering whether Twilio’s current share price lines up with its underlying worth, you are not alone. This article is here to unpack the numbers in a clear, practical way.
- Twilio’s stock closed at US$110.44, with returns of a 1.3% decline over 7 days, a 16.3% decline over 30 days, a 20.2% decline year to date, a 23.6% decline over 1 year and a 67.2% gain over 3 years, alongside a 73.2% decline over 5 years. Taken together, these figures suggest investors have been repeatedly reassessing the company’s risk and reward profile.
- Recent coverage around Twilio has focused on how the company is repositioning itself within the software sector and how that repositioning might affect its long term growth narrative. This context helps explain why the share price has seen sharp moves as the market reacts to changing expectations.
- On Simply Wall St’s valuation checks, Twilio scores 3 out of 6 for being potentially undervalued, giving it a 3/6 valuation score. Next we will look at how different valuation methods judge the stock, before finishing with a way of thinking about value that goes beyond any single model.
Approach 1: Twilio Discounted Cash Flow (DCF) Analysis
A Discounted Cash Flow, or DCF, model takes Twilio’s estimated future cash flows and discounts them back to today’s dollars, giving an estimate of what the whole business might be worth now.
For Twilio, the model uses last twelve months free cash flow of about $778.5 million and a 2 Stage Free Cash Flow to Equity approach. Analysts provide cash flow estimates for the earlier years, and Simply Wall St then extends those projections further out. By 2030, the model is using a projected free cash flow of $1.22b, with each future year discounted back to reflect the time value of money and risk.
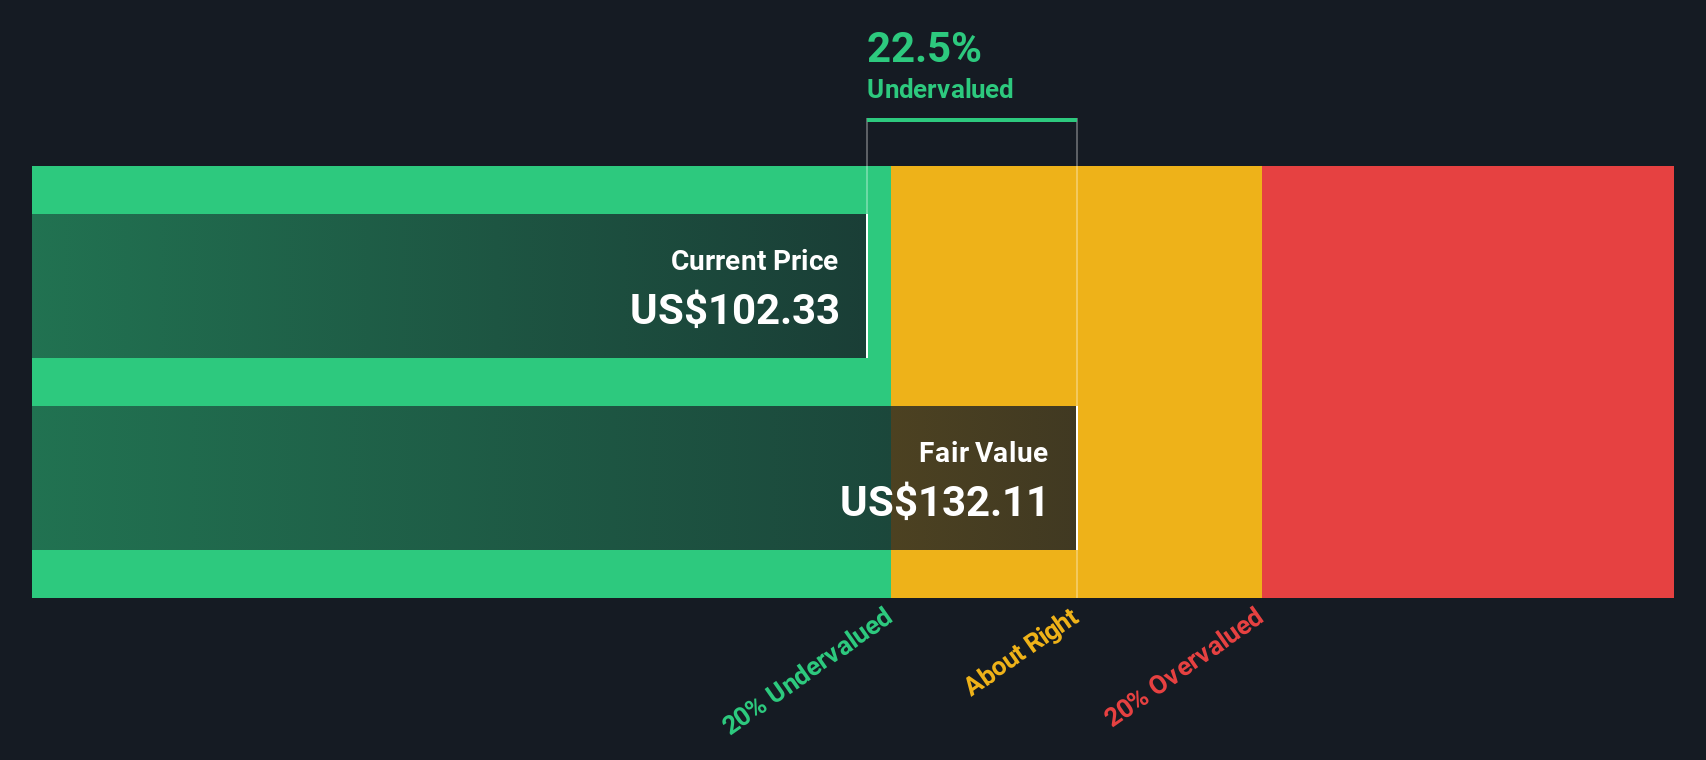
When all those discounted cash flows are added together, the DCF model arrives at an estimated intrinsic value of about $124.03 per share. Compared with the recent share price of $110.44, this implies Twilio trades at roughly an 11.0% discount, which indicates the stock is modestly undervalued on this measure.
Result: UNDERVALUED
Our Discounted Cash Flow (DCF) analysis suggests Twilio is undervalued by 11.0%. Track this in your watchlist or portfolio, or discover 51 more high quality undervalued stocks.
Approach 2: Twilio Price vs Sales
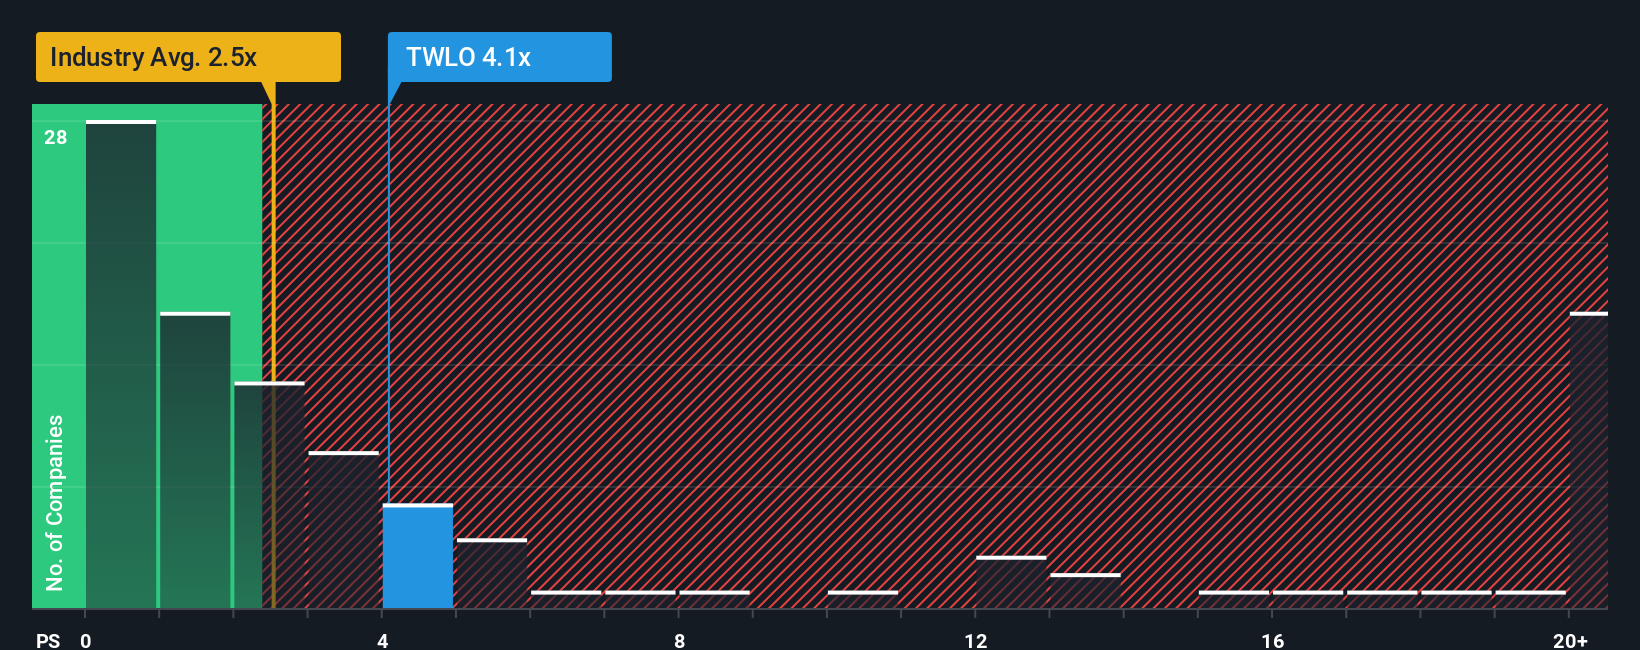
For companies where investors focus on revenue potential, the P/S ratio is a useful way to compare what the market is paying for each dollar of sales. It is especially relevant when earnings are less of a focus and cash flows and margins are still evolving.
What counts as a fair P/S multiple usually reflects a mix of growth expectations and risk. Higher expected growth and lower perceived risk tend to support a higher P/S, while slower growth or higher uncertainty usually point to a lower, more conservative multiple.
Twilio currently trades on a P/S of 3.42x. That sits above the broader IT industry average of about 2.06x, but below the peer group average of around 5.82x. Simply Wall St’s Fair Ratio for Twilio is 4.27x. This Fair Ratio is a proprietary estimate of what P/S might be reasonable after accounting for factors such as earnings growth, profit margins, industry, market cap and company specific risks.
Because the Fair Ratio is tailored to Twilio’s profile, it can be more informative than a simple comparison with peers or the sector, which may have very different growth and risk characteristics. With the shares at 3.42x versus a Fair Ratio of 4.27x, Twilio screens as undervalued on this measure.
Result: UNDERVALUED
P/S ratios tell one story, but what if the real opportunity lies elsewhere? Start investing in legacies, not executives. Discover our 22 top founder-led companies.
Upgrade Your Decision Making: Choose your Twilio Narrative
Earlier we mentioned that there is an even better way to understand valuation, so let us introduce you to Narratives, which are simply the story you believe about a company like Twilio tied directly to your own assumptions for future revenue, earnings, margins and fair value.
On Simply Wall St’s Community page, Narratives are an easy tool that let you set those assumptions, link them to a forecast and arrive at a Fair Value you can compare with the current share price to help decide whether Twilio looks more like a buy, a hold or a sell for you. They update automatically as new earnings, news or guidance come through.
For Twilio, for example, one Narrative on the platform anchors on a fair value of about US$68.00 while another points to around US$194.38. You can see in one place how more cautious and more optimistic investors translate very different stories about regulation, AI adoption and profitability into specific numbers and a fair value range that you can benchmark your own view against.
For Twilio, however, we will make it really easy for you with previews of two leading Twilio Narratives:
Fair value: US$118.66 per share
Implied upside versus the recent US$110.44 share price: about 6.9%
Revenue growth assumption: 7.07%
- Views Twilio as an information technology player in internet services and infrastructure with sizeable scale at around US$16.55b in market capitalization.
- Highlights third party quantitative ratings that score the stock highly within its sector and industry, with a focus on AI and machine learning across the platform and integrations such as OpenAI’s real time API.
- Points to recent operating metrics such as Q3 revenue growth, higher non GAAP operating margins, strong cash from operations and positive analyst estimate revisions as support for an attractive opportunity at current valuation multiples like P/B.
Fair value: US$68.00 per share
Implied downside versus the recent US$110.44 share price: about 62.4% overvalued
Revenue growth assumption: 24.14%
- Argues that Twilio does not yet fit a traditional value style framework that prioritizes consistent profitability, predictable earnings and a wide, durable moat.
- Flags competitive and business model risks tied to a tech centered communications platform, where the pace of change and pressure from rivals may limit long term visibility.
- Suggests the current price does not offer a clear margin of safety and that the shares might appeal more to growth focused investors unless the company reaches sustained GAAP profitability or trades at what this view would consider a much lower valuation.
Do you think there's more to the story for Twilio? Head over to our Community to see what others are saying!

This article by Simply Wall St is general in nature. We provide commentary based on historical data and analyst forecasts only using an unbiased methodology and our articles are not intended to be financial advice. It does not constitute a recommendation to buy or sell any stock, and does not take account of your objectives, or your financial situation. We aim to bring you long-term focused analysis driven by fundamental data. Note that our analysis may not factor in the latest price-sensitive company announcements or qualitative material. Simply Wall St has no position in any stocks mentioned.