
Please use a PC Browser to access Register-Tadawul
Get It
Is Vital Farms (VITL) Now Attractive After Recent Share Price Pullback?
Vital Farms, Inc. VITL | 27.17 | -1.38% |
A Discounted Cash Flow, or DCF, model takes estimates of the cash a business may generate in the future and discounts those amounts back to today to get an implied value per share.
For Vital Farms, the latest twelve month Free Cash Flow is about $6.7 million. Using a 2 Stage Free Cash Flow to Equity approach, analysts provide cash flow estimates out to 2027, then Simply Wall St extrapolates further. By 2035, the model is projecting Free Cash Flow of about $781.1 million, with each future year discounted back to reflect the time value of money.
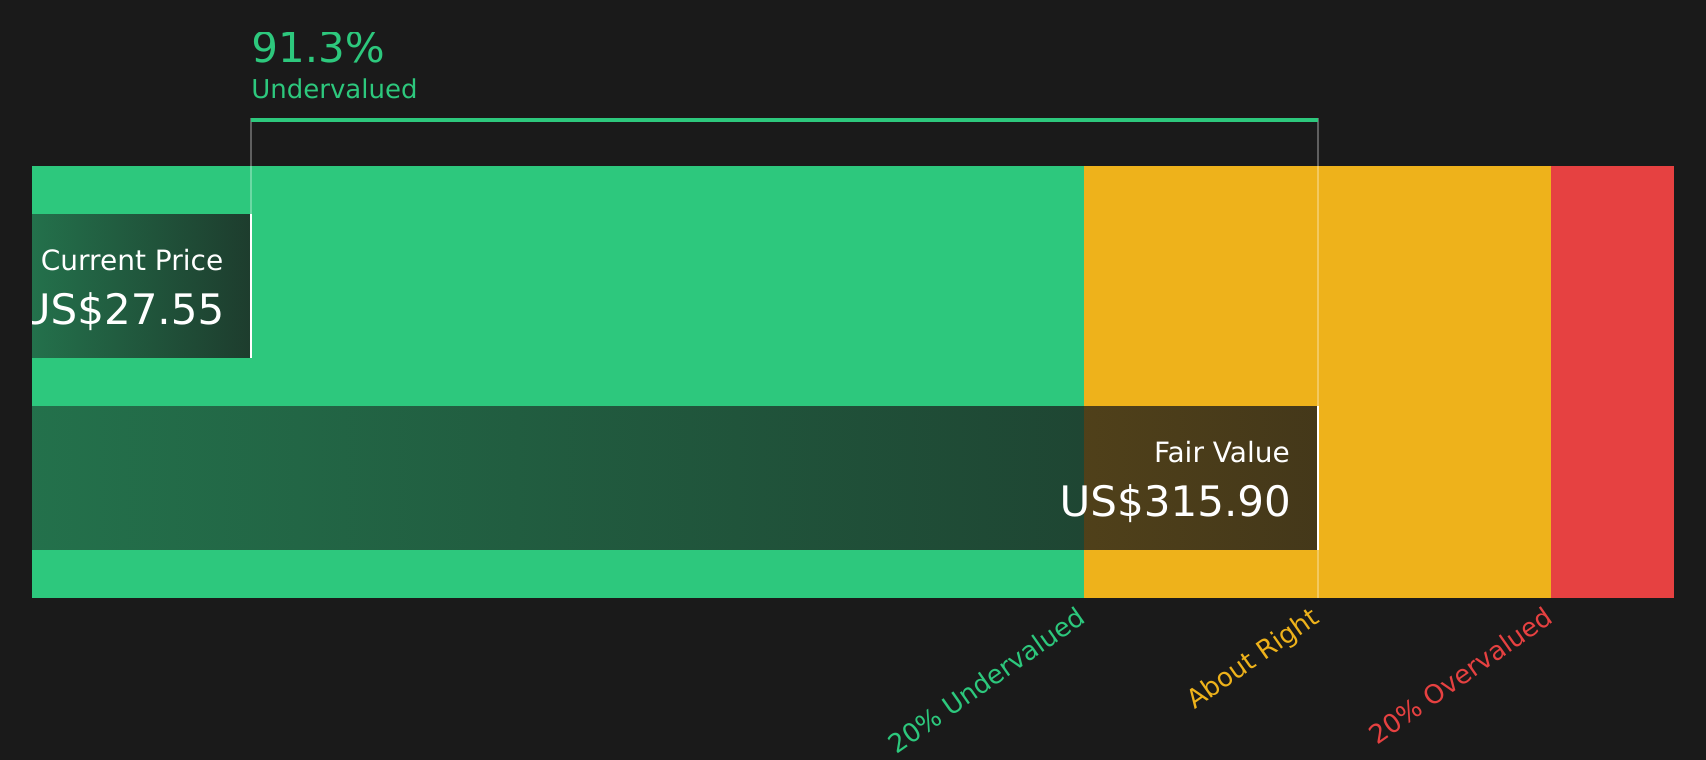
Adding those discounted cash flows together results in an estimated intrinsic value of about $305.16 per share. Compared with the recent share price of around $29.49, the model suggests Vital Farms is about 90.3% undervalued based on these inputs and assumptions.
Result: UNDERVALUED
Our Discounted Cash Flow (DCF) analysis suggests Vital Farms is undervalued by 90.3%. Track this in your watchlist or portfolio, or discover 865 more undervalued stocks based on cash flows.
For a profitable company like Vital Farms, the P/E ratio is a useful way to think about what you are paying for each dollar of current earnings. This makes it a common shorthand for how the market is treating the stock.
What counts as a “normal” P/E often reflects how the market sees growth potential and risk. Higher expected growth and lower perceived risk can support a higher multiple, while slower growth or higher uncertainty usually point to a lower one.
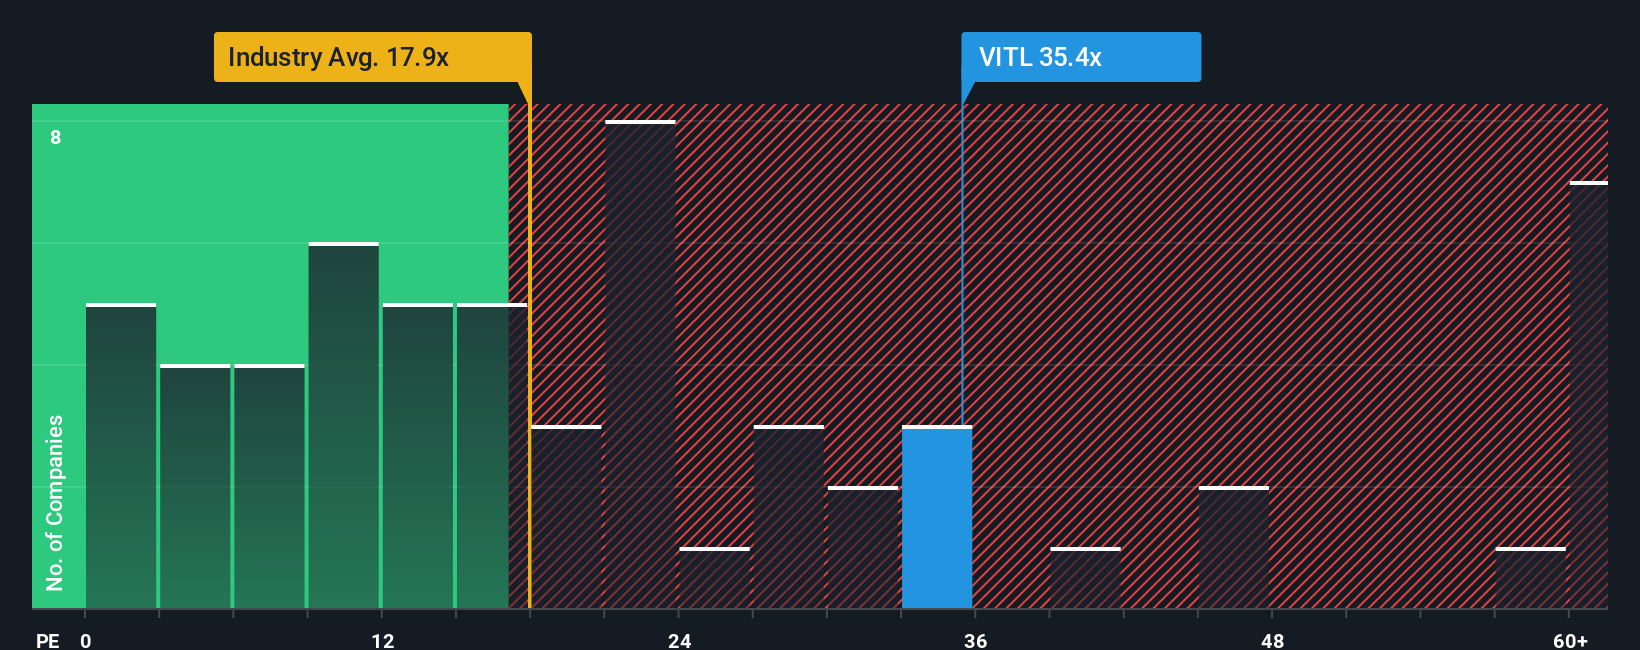
Vital Farms currently trades on a P/E of about 21.8x. That is close to the Food industry average of roughly 21.3x and well below the peer group average of about 81.3x. Simply Wall St also calculates a Fair Ratio of 20.0x, which is the P/E level its model suggests based on factors like earnings growth, industry, profit margin, market cap and specific risks.
This Fair Ratio is more tailored than a simple peer or industry comparison because it adjusts for the company’s own characteristics rather than assuming all Food stocks deserve the same multiple. With the current P/E of 21.8x versus a Fair Ratio of 20.0x, Vital Farms screens as slightly expensive on this metric.
Result: OVERVALUED
P/E ratios tell one story, but what if the real opportunity lies elsewhere? Discover 1440 companies where insiders are betting big on explosive growth.
Earlier we mentioned that there is an even better way to understand valuation. Narratives on Simply Wall St let you attach a clear story about Vital Farms to your numbers by linking your view of its revenue, earnings and margins to a financial forecast. This turns that into a Fair Value you can compare with the current price to help you decide whether to buy, hold or sell. Each Narrative lives on the Community page, updates automatically when fresh news or earnings arrive, and can reflect very different viewpoints. For example, one investor may expect strong brand strength and index additions to support a Fair Value around US$60.00, while another may focus more on capital intensity, competition and discounting risk and land closer to US$48.00. All of this is presented in a simple, accessible format used by millions of investors.
Do you think there's more to the story for Vital Farms? Head over to our Community to see what others are saying!

This article by Simply Wall St is general in nature. We provide commentary based on historical data and analyst forecasts only using an unbiased methodology and our articles are not intended to be financial advice. It does not constitute a recommendation to buy or sell any stock, and does not take account of your objectives, or your financial situation. We aim to bring you long-term focused analysis driven by fundamental data. Note that our analysis may not factor in the latest price-sensitive company announcements or qualitative material. Simply Wall St has no position in any stocks mentioned.
