Janus Henderson Group (JHG) Net Margin Expansion Reinforces Bullish Earnings Narrative
Janus Henderson Group PLC JHG | 51.50 | +0.16% |
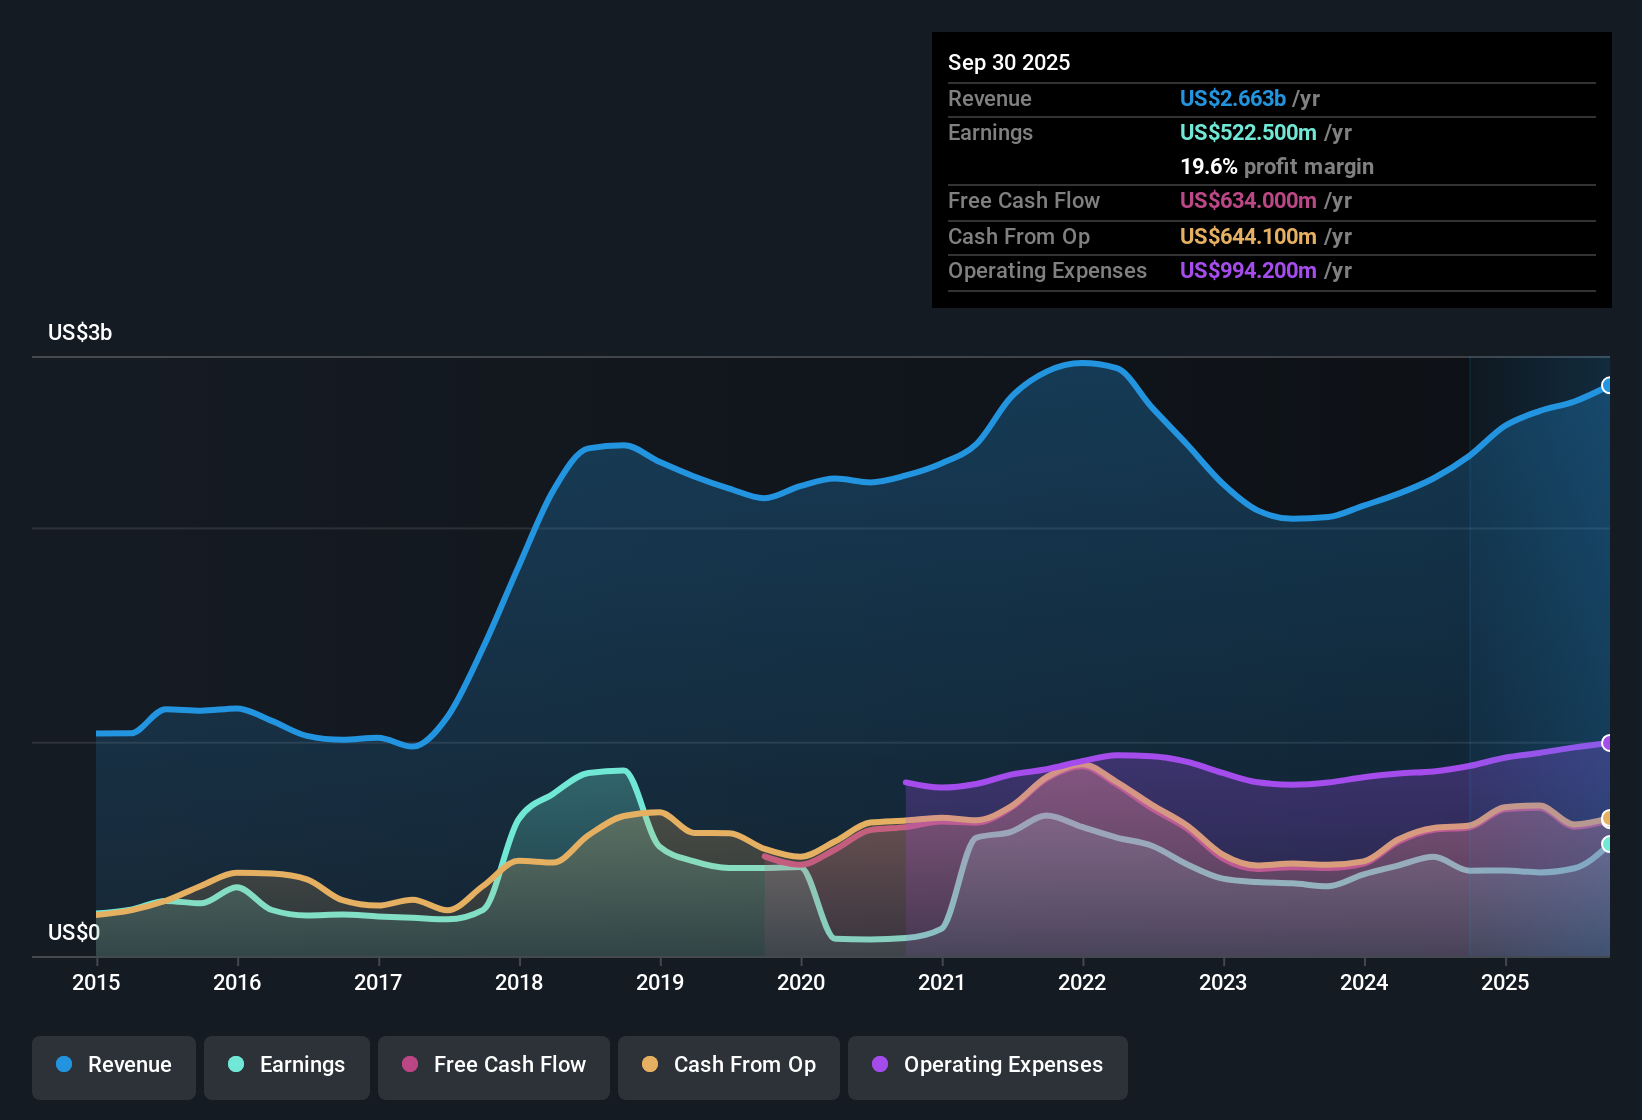
Janus Henderson Group (NYSE:JHG) has just posted its FY 2025 third quarter numbers, with revenue of US$700.4 million and basic EPS of US$0.92. This is set against trailing 12 month revenue of US$2.66 billion and EPS of US$3.41 that also reflect a 31.2% year over year earnings increase and a net profit margin of 19.6% versus 17.1% in the prior year. Over recent quarters, revenue has ranged from US$588.4 million in Q2 2024 to US$708.3 million in Q4 2024, while basic EPS has moved between US$0.17 in Q3 2024 and US$0.95 in Q2 2025. This gives investors a clearer view of how the top and bottom lines are tracking into this latest print. With margins currently higher on a trailing basis and earnings growth outpacing that margin shift, the focus now turns to how durable these profitability levels look against the growth outlook that management and the market are working with.
See our full analysis for Janus Henderson Group.With the numbers on the table, the next step is to set these results against the bigger stories around Janus Henderson, testing how the latest trends in growth and margins line up with the widely followed narratives and where they might start to push back on them.
AUM climbs to US$483.8b with fresh inflows
- AUM moved from US$457.3b at the start of Q3 2025 to US$483.8b at the end, with net inflows of US$7.8b on top of market moves.
- What stands out against the generally optimistic view is that, while the AI narrative highlights Janus Henderson’s diversified global platform, the Q3 figures show that this growth is currently coming through in fairly traditional fashion via higher AUM and inflows rather than any specific new product push.
- The US$7.8b Q3 inflow follows US$46.7b in Q2 and US$2.0b in Q1, so the recent 12 month story is heavily about gathering assets.
- With trailing 12 month revenue at US$2.66b, the larger AUM base is already feeding into the fee line that investors watch closely for asset managers.
Margins and earnings hold up at 19.6% profitability
- On a trailing 12 month basis, net income of US$522.5 million on revenue of US$2.66b translates to a 19.6% net margin, compared with 17.1% cited for the prior year period.
- Bulls would argue that this margin profile, together with the 31.2% trailing 12 month earnings growth, heavily supports the idea that the business model is currently converting higher fees into bottom line profit, even though the longer 5 year trend shows an average 3.5% annual earnings decline.
- Q3 2025 net income of US$138.8 million sits above most quarterly figures given, while Q3 EPS of US$0.92 contributes to trailing EPS of US$3.41.
- The combination of a 19.6% margin and US$522.5 million in trailing net income helps explain why recent profitability metrics are being highlighted as strong, despite the weaker multi year history.
P/E discount versus peers and DCF fair value
- With the share price at US$48.13, Janus Henderson’s trailing P/E of 14.2x sits below peers at 17.6x, the US Capital Markets industry at 23.9x and the broader US market at 19.2x, while a DCF fair value of US$36.77 is below the current price and an analyst target of US$50.14 is slightly above it.
- What critics point to is the tension between the apparent P/E discount and the softer forward outlook, as near term forecasts call for 0.6% yearly earnings growth and 3.4% yearly revenue growth versus 16.1% and 10.6% for the broader US market, which can limit how much weight investors put on the lower multiple.
- The 31.2% trailing earnings growth and 19.6% margin support arguments that the current earnings base is solid, yet the DCF fair value of US$36.77 suggests a more cautious stance when those earnings are projected forward.
- Because the current price of US$48.13 is close to the US$50.14 target, the market already reflects some of that recent strength, even though the five year trend shows earnings declining by 3.5% per year on average.
Next Steps
Don't just look at this quarter; the real story is in the long-term trend. We've done an in-depth analysis on Janus Henderson Group's growth and its valuation to see if today's price is a bargain. Add the company to your watchlist or portfolio now so you don't miss the next big move.
See What Else Is Out There
Janus Henderson’s recent profitability and inflows sit alongside a softer forward outlook, with modest forecast earnings and revenue growth compared with the broader US market and a longer term earnings decline.
If that slower growth profile gives you pause, use our stable growth stocks screener (2167 results) to quickly focus on companies with steadier revenue and earnings trends that may better fit a long term plan.
This article by Simply Wall St is general in nature. We provide commentary based on historical data and analyst forecasts only using an unbiased methodology and our articles are not intended to be financial advice. It does not constitute a recommendation to buy or sell any stock, and does not take account of your objectives, or your financial situation. We aim to bring you long-term focused analysis driven by fundamental data. Note that our analysis may not factor in the latest price-sensitive company announcements or qualitative material. Simply Wall St has no position in any stocks mentioned.