
Please use a PC Browser to access Register-Tadawul
Get It
LendingClub (LC) Valuation Check After Analyst Upgrades And Strong Recent Shareholder Returns
LendingClub Corp LC | 16.26 | -1.93% |
LendingClub (LC) moved higher after Citizens upgraded the stock to Market Outperform, citing loan origination growth prospects and expected business scale. JPMorgan maintained its Top Pick stance despite challenges in the fintech sector.
The analyst upgrade comes after a strong run, with the share price at US$21.58 and a 90 day share price return of 17.09%, alongside a 1 year total shareholder return of 27.39%, suggesting that momentum has been building.
If LendingClub’s recent move has your attention, this could be a good moment to look at fast growing stocks with high insider ownership for other fast moving ideas with committed insider backing.
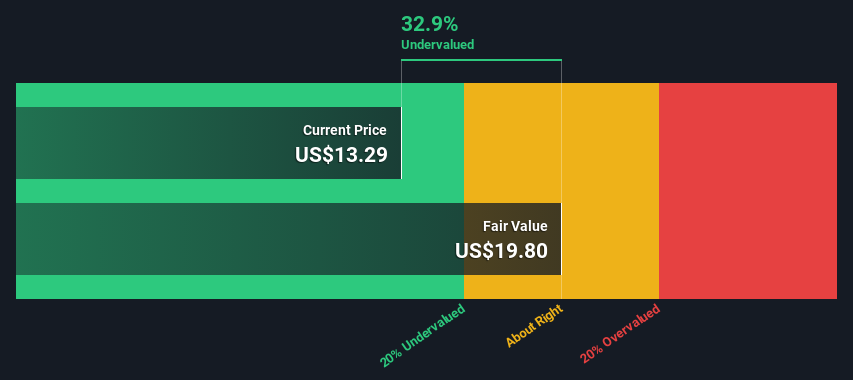
With the shares at US$21.58, trading around 10% below one analyst price target and at an internal value estimate implying a roughly 43% discount, you have to ask: is there still mispricing here, or is the market already banking on future growth?
At US$21.58, LendingClub is on a P/E of 24x, which sits well above several reference points and suggests the market is paying up for its earnings.
The P/E multiple links the current share price to the last twelve months of earnings per share. It is a quick shorthand for how much investors are willing to pay for each dollar of profit. For a diversified financials business like LendingClub, that often reflects the market’s view on how durable current earnings are and how much growth could be ahead.
Here, the gap is clear. The 24x P/E is higher than the estimated fair P/E of 21.4x and stands at a strong premium to the US Consumer Finance industry average of 8.8x and a peer average of 6.2x. That kind of spread suggests investors are accepting a much richer multiple than both the sector and the level our fair ratio implies the market could eventually move toward.
Result: Price-to-Earnings of 24x (OVERVALUED)
However, you still have to weigh the risk that a premium 24x P/E leaves less room for error if loan growth or net income of US$103.843m soften.
The P/E of 24x paints LendingClub as expensive, but our DCF model suggests something quite different. At US$21.58, the shares sit about 43% below an intrinsic value estimate of US$38.05, which frames the current price as discounted rather than stretched. So which signal do you trust more: earnings or cash flows?
Simply Wall St performs a discounted cash flow (DCF) on every stock in the world every day (check out LendingClub for example). We show the entire calculation in full. You can track the result in your watchlist or portfolio and be alerted when this changes, or use our stock screener to discover 878 undervalued stocks based on their cash flows. If you save a screener we even alert you when new companies match - so you never miss a potential opportunity.
If the story here does not quite match your view, or you prefer to test the numbers yourself, you can build a fresh narrative in just a few minutes with Do it your way.
A great starting point for your LendingClub research is our analysis highlighting 3 key rewards and 1 important warning sign that could impact your investment decision.
If LendingClub interests you, do not stop here. Use the Simply Wall St Screener to spot other opportunities that fit the kind of portfolio you want to build.
This article by Simply Wall St is general in nature. We provide commentary based on historical data and analyst forecasts only using an unbiased methodology and our articles are not intended to be financial advice. It does not constitute a recommendation to buy or sell any stock, and does not take account of your objectives, or your financial situation. We aim to bring you long-term focused analysis driven by fundamental data. Note that our analysis may not factor in the latest price-sensitive company announcements or qualitative material. Simply Wall St has no position in any stocks mentioned.
