Please use a PC Browser to access Register-Tadawul
Liberty Energy (LBRT) Margin Compression To 3.7% Reinforces Bearish Earnings Narratives
Liberty Energy, Inc. Class A LBRT | 26.85 | -0.15% |
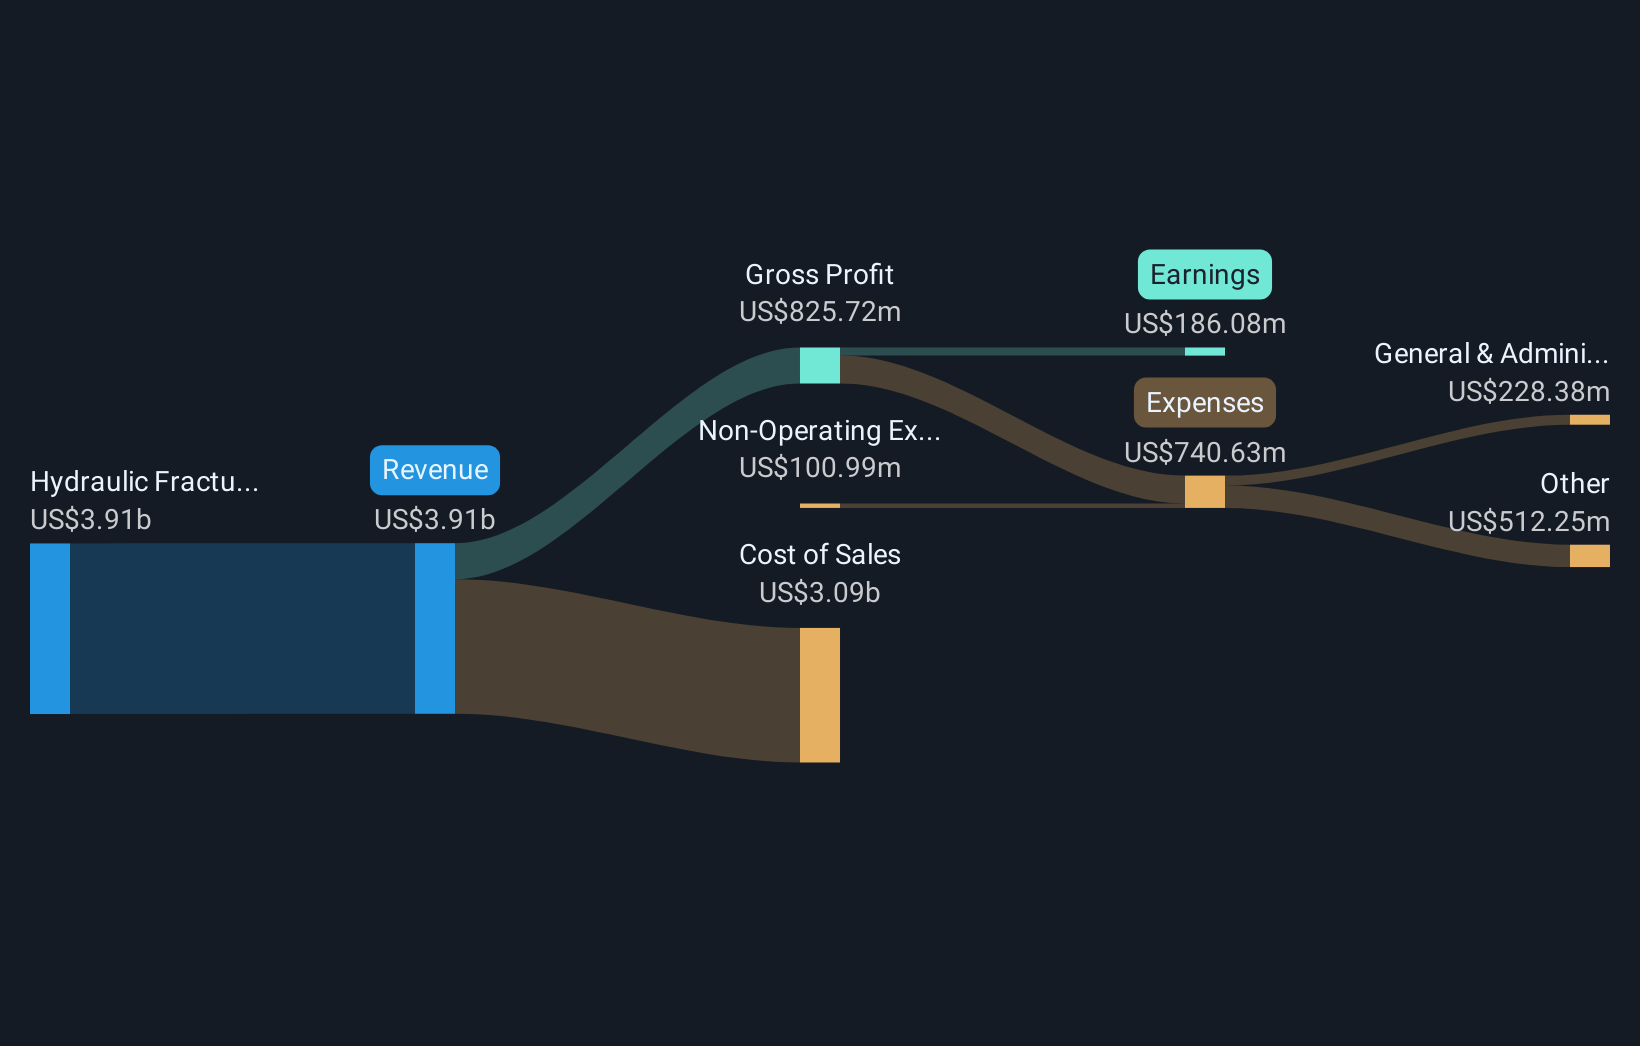
Liberty Energy (LBRT) closed out FY 2025 with Q4 revenue of US$1.0b and basic EPS of US$0.08, alongside net income of US$13.7m, while the trailing twelve months show EPS of US$0.91 on revenue of US$4.0b and net income of US$147.9m. Over recent quarters, revenue has moved between US$947.4m and US$1.0b, with quarterly EPS ranging from US$0.08 to US$0.44, giving investors a clear picture of how earnings have tracked against a relatively steady top line. With the shares at US$25.34, the focus now is on how these results fit with expectations around margins, cash generation, and the durability of the current profit profile.
See our full analysis for Liberty Energy.With the latest numbers on the table, the next step is to set them against the most followed narratives around Liberty Energy’s earnings power, margin resilience, and potential growth to see which views hold up and which might need rethinking.
Margins Slide From 7.3% To 3.7%
- Over the last 12 months, Liberty Energy’s net margin was 3.7% on US$4.0b of revenue, compared with 7.3% on US$4.3b a year earlier, showing that profitability did not keep pace with the revenue base.
- Bears focus on this margin compression as backing their cautious view, because:
- Net income on a trailing basis is US$147.9m versus US$316.0m in the prior 12 month period, so earnings are sitting on a smaller slice of revenue even though revenue stayed close to US$4.0b.
- Consensus expectations for roughly 9.2% yearly earnings decline over the next three years line up with this margin step down, which skeptics argue points to pressure on underlying profitability.
Trailing EPS 0.91 Heavily Skewed By One Off
- Trailing twelve month EPS sits at US$0.91 on net income of US$147.9m, but that period includes a US$145.1m one off gain, meaning a large portion of reported profit is tied to a single non recurring item.
- What stands out for cautious investors is how this interacts with the bearish narrative, because:
- The one off gain inflates reported profitability over the last year at the same time that net margin has eased back to 3.7%, so reported EPS does not fully reflect underlying operating performance.
- With consensus calling for around 9.2% yearly earnings decline, critics argue that once you strip out the US$145.1m gain, the earnings base that future forecasts are built on looks more modest than the headline EPS suggests.
Valuation: 24.2% Gap To DCF Fair Value
- At a share price of US$25.34, Liberty Energy trades about 24.2% below the DCF fair value estimate of US$33.42 and on a 27.8x trailing P/E, which is lower than the 43.3x peer average but higher than the 21.9x US Energy Services industry level.
- Supporters of the more bullish angle point to this as a valuation story with trade offs, because:
- The gap between US$25.34 and the US$33.42 DCF fair value, along with a trailing P/E below peers, is used to argue the stock is priced more conservatively than many comparable names.
- On the other hand, compressed margins, the reliance on a US$145.1m one off gain in the last 12 months, and forecasts of a 9.2% annual earnings decline are exactly what critics reference when they question how much weight to put on that apparent discount.
Next Steps
Don't just look at this quarter; the real story is in the long-term trend. We've done an in-depth analysis on Liberty Energy's growth and its valuation to see if today's price is a bargain. Add the company to your watchlist or portfolio now so you don't miss the next big move.
Explore Alternatives
Liberty Energy’s earnings story leans on a US$145.1m one off gain and thinner 3.7% margins, while consensus points to yearly earnings decline ahead.
If you want ideas with a clearer earnings path and fewer one offs, check out CTA_SCREENER_STABLE_GROWTH to focus on companies built around steadier growth profiles.
This article by Simply Wall St is general in nature. We provide commentary based on historical data and analyst forecasts only using an unbiased methodology and our articles are not intended to be financial advice. It does not constitute a recommendation to buy or sell any stock, and does not take account of your objectives, or your financial situation. We aim to bring you long-term focused analysis driven by fundamental data. Note that our analysis may not factor in the latest price-sensitive company announcements or qualitative material. Simply Wall St has no position in any stocks mentioned.


