
Please use a PC Browser to access Register-Tadawul
Get It
Market Cool On Topgolf Callaway Brands Corp.'s (NYSE:MODG) Revenues
Topgolf Callaway Brands Corp. Common Stock MODG | 11.40 | -1.98% |
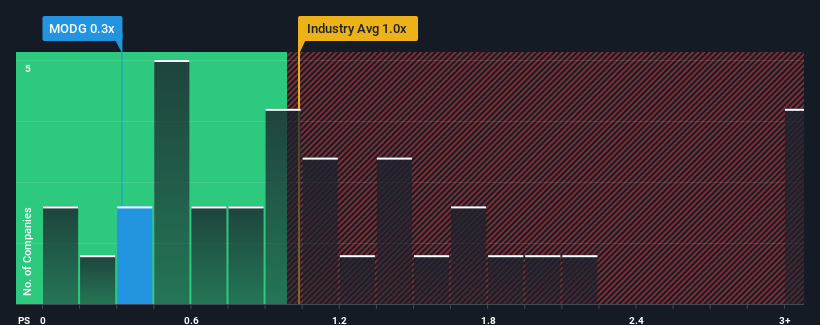
When close to half the companies operating in the Leisure industry in the United States have price-to-sales ratios (or "P/S") above 1x, you may consider Topgolf Callaway Brands Corp. (NYSE:MODG) as an attractive investment with its 0.3x P/S ratio. However, the P/S might be low for a reason and it requires further investigation to determine if it's justified.
Recent times have been more advantageous for Topgolf Callaway Brands as its revenue hasn't fallen as much as the rest of the industry. One possibility is that the P/S ratio is low because investors think this relatively better revenue performance might be about to deteriorate significantly. You'd much rather the company continue improving its revenue if you still believe in the business. In saying that, existing shareholders probably aren't pessimistic about the share price if the company's revenue continues outplaying the industry.
Keen to find out how analysts think Topgolf Callaway Brands' future stacks up against the industry? In that case, our free report is a great place to start.Topgolf Callaway Brands' P/S ratio would be typical for a company that's only expected to deliver limited growth, and importantly, perform worse than the industry.
Taking a look back first, we see that there was hardly any revenue growth to speak of for the company over the past year. Still, the latest three year period has seen an excellent 51% overall rise in revenue, in spite of its uninspiring short-term performance. So while the company has done a solid job in the past, it's somewhat concerning to see revenue growth decline as much as it has.
Looking ahead now, revenue is anticipated to climb by 3.9% per annum during the coming three years according to the analysts following the company. Meanwhile, the rest of the industry is forecast to expand by 3.2% per year, which is not materially different.
With this in consideration, we find it intriguing that Topgolf Callaway Brands' P/S is lagging behind its industry peers. Apparently some shareholders are doubtful of the forecasts and have been accepting lower selling prices.
Typically, we'd caution against reading too much into price-to-sales ratios when settling on investment decisions, though it can reveal plenty about what other market participants think about the company.
We've seen that Topgolf Callaway Brands currently trades on a lower than expected P/S since its forecast growth is in line with the wider industry. Despite average revenue growth estimates, there could be some unobserved threats keeping the P/S low. At least the risk of a price drop looks to be subdued, but investors seem to think future revenue could see some volatility.
Many other vital risk factors can be found on the company's balance sheet. Take a look at our free balance sheet analysis for Topgolf Callaway Brands with six simple checks on some of these key factors.
This article by Simply Wall St is general in nature. We provide commentary based on historical data and analyst forecasts only using an unbiased methodology and our articles are not intended to be financial advice. It does not constitute a recommendation to buy or sell any stock, and does not take account of your objectives, or your financial situation. We aim to bring you long-term focused analysis driven by fundamental data. Note that our analysis may not factor in the latest price-sensitive company announcements or qualitative material. Simply Wall St has no position in any stocks mentioned.
