
Please use a PC Browser to access Register-Tadawul
Get It
Market Movements Now | SHL (1183) Shares Jump on Massive 1,040% Earnings Improvement; Theeb (4261) Sees Unusual Volume Spike, Surges by 20.46% Compared to 3-Month Average
SHL 1183.SA | 17.78 | -1.77% |
THEEB 4261.SA | 61.05 | +0.08% |
SULAIMAN ALHABIB 4013.SA | 258.20 | -0.23% |
CENOMI RETAIL 4240.SA | 19.46 | +0.83% |
ARTEX 2340.SA | 11.35 | -0.61% |
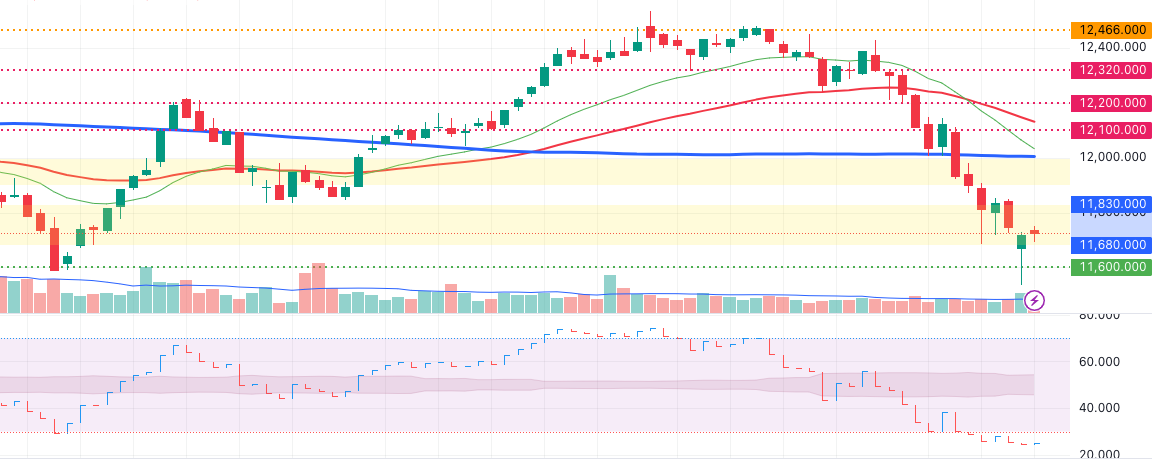
The Tadawul All Shares Index(TASI.SA) experienced a significant dip yesterday, reaching levels last seen at the end of November last year before rebounding. This movement formed a so-called "hammer" candlestick pattern, suggesting a potential confirmation of support at this level. However, whether this marks the beginning of a sustained rebound remains to be seen, necessitating careful observation of future movements. Currently, the index is trading within the crucial range of 11,680 to 11,830.
SHL Shares Jump on Massive 1,040% Earnings Improvement
SHL Finance Co.(1183.SA) reported a 1,040.5% increase in net profit to SAR 26.5 million for 2024, driven by higher profit rates on new loans and increased special commission income, which grew 17.7% to SAR 359.5 million. The company's financing portfolio expanded 3.7% while reversals of expected credit loss provisions increased 47% due to improved portfolio performance and reduced non-performing loans.
| Element List | Current Year | Previous Year | %Change |
|---|---|---|---|
| Total Income From Special Commission of Financing | 359,473 | 305,503 | 17.66 |
| Net Income From Special Commission of Financing | 150,269 | 117,654 | 27.72 |
| Net Income From Special Commission of Investment | - | - | - |
| Total Operations Profit (Loss) | 150,269 | 117,654 | 27.72 |
| Net Profit (Loss) before Zakat and Income Tax | 33,899 | 2,890 | 1,072.97 |
| Net profit (Loss) | 26,528 | 2,326 | 1,040.5 |
| Total Comprehensive Income | 26,985 | 1,935 | 1,294.57 |
| Assets | 4,513,467 | 4,383,359 | 2.97 |
| Investments | 893 | 893 | - |
| Loans And Advances Portfolio (Financing And Investment) | 4,349,180 | 4,192,608 | 3.73 |
| Clients' deposits | - | - | - |
| Total Shareholders Equity (after Deducting Minority Equity) | 1,687,638 | 1,660,653 | 1.62 |
| Total Operating Expenses Before Provisions for Credit and Other Losses | 327,560 | 299,513 | 9.36 |
| Total Provision of Expected Credit Losses And Other Losses (Reversing Entry), Net | -5,385 | -3,664 | 46.97 |
| Profit (Loss) per Share | 0.27 | 0.02 | |
| All figures are in (Thousands) Saudi Arabia, Riyals | |||
| Symbol | Volume Change% | 3M Average Volume | Today's Volume So Far |
| Theeb Rent a Car Co.(4261.SA) | 20.46% | 79,987 | 96,350 |
| Dr. Sulaiman Al Habib Medical Services Group(4013.SA) | 7.78% | 192,809 | 207,809 |
| Company | Price (SAR) |
|---|---|
| - | - |
| Company | Price | Change |
|---|---|---|
| SHL Finance Co.(1183.SA) | 17.28 | +6.93% |
| Fawaz Abdulaziz Alhokair Co.(4240.SA) | 12.62 | +4.47% |
| Theeb Rent a Car Co.(4261.SA) | 73.00 | +4.29% |
| ARTEX Industrial Investment Co.(2340.SA) | 13.60 | +3.50% |
| Saudi Ceramic Co.(2040.SA) | 28.15 | +3.49% |
| Company | Price | Change |
|---|---|---|
| Savola Group(2050.SA) | 31.70 | -2.46% |
| ACWA POWER Co.(2082.SA) | 335.40 | -2.04% |
| Saudi Marketing Co.(4006.SA) | 21.50 | -2.01% |
| Saudi Research and Media Group(4210.SA) | 166.60 | -2.00% |
| Bupa Arabia for Cooperative Insurance Co.(8210.SA) | 173.60 | -1.92% |
- Reporting by Zaid, Sahm News team
