Marriott International (MAR) has wrapped up FY 2025 with fourth quarter revenue of US$6.7b, basic EPS of US$1.66 and net income of US$445m, while trailing 12 month revenue stands at US$26.2b, basic EPS at US$9.53 and net income at US$2.6b. The company has seen quarterly revenue move from US$1.7b in Q4 2024 to US$6.7b in Q4 2025, with basic EPS shifting from US$1.63 to US$1.66 over the same period, and trailing 12 month revenue and EPS also tracked across the last six quarters. With a trailing net margin of 9.9% versus last year’s 35.9%, the latest numbers put profitability and how it is trending firmly in focus for investors.
See our full analysis for Marriott International.
With the headline figures on the table, the next step is to set these results against the main stories investors follow about Marriott, highlighting where the latest numbers support those narratives and where they start to push back.
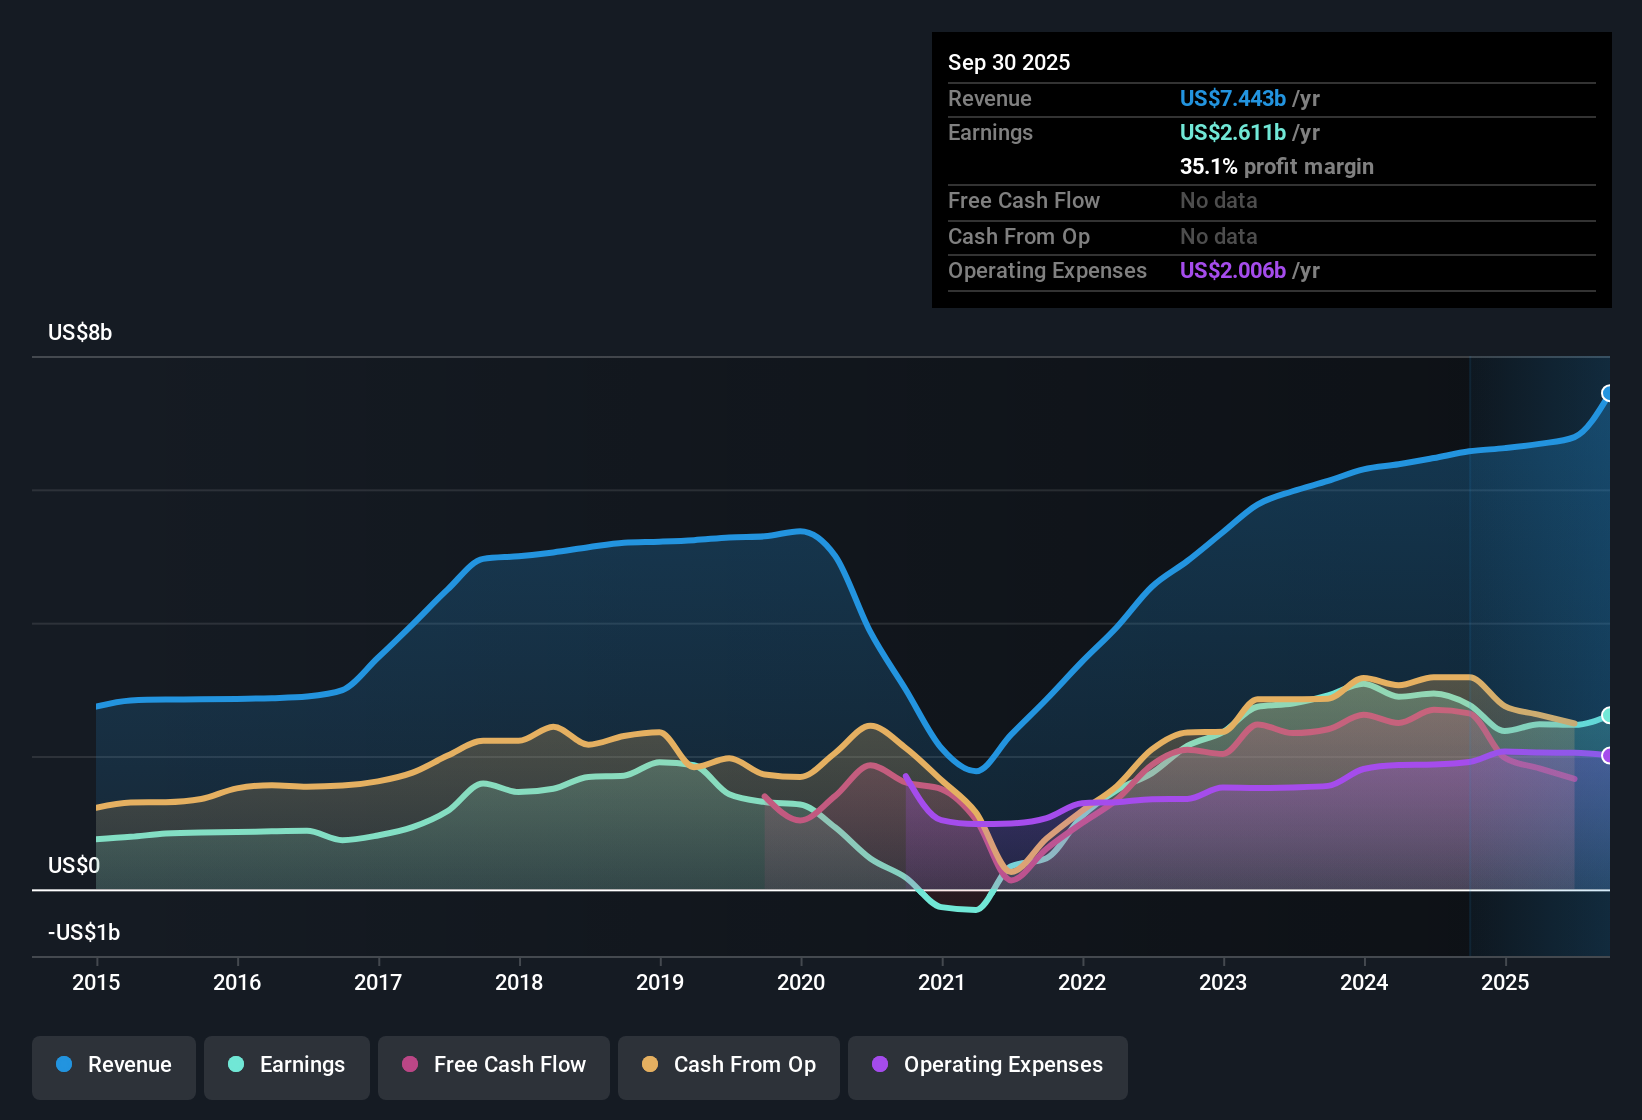
NasdaqGS:MAR Earnings & Revenue History as at Feb 2026
TTM profit margin at 9.9% raises questions for bulls
On a trailing 12 month basis, Marriott earned US$2.6b of net income on US$26.2b of revenue, which works out to a 9.9% net margin compared with 35.9% in the prior year. The current snapshot therefore lines up with the risk data pointing to pressure on profitability.
Consensus narrative expects long term earnings and margin growth supported by global expansion, technology upgrades and high margin fee streams. However, the latest 9.9% margin and US$445m of Q4 net income invite you to weigh those expansion drivers against the more recent compression in reported profitability.
Analysts reference multi year earnings growth of 27.6% a year and forecast around 10.3% earnings growth per year, which fits the story of a business building on a large system of hotels and loyalty members.
At the same time, the data flags that debt is not well covered by operating cash flow and that recent margins are lower than last year. This sits awkwardly beside the idea of steadily improving earnings quality.
Investors who want to see how different views join these margin and growth threads together might find the community bull and bear cases for Marriott helpful before forming their own stance.
P/E of 37.1x and US$359.35 price stretch valuation
The shares trade at US$359.35 with a P/E of 37.1x, compared with 22.2x for the US Hospitality industry and 30.6x for peers. A DCF fair value of about US$271.58 in the data sits below the current price, which underlines how much optimism is already reflected in the valuation multiples.
Consensus narrative points to global and mid scale expansion, a growing loyalty base and technology investment as reasons earnings can keep supporting that premium. Yet the combination of a 37.1x P/E and net margin at 9.9% gives you a very different reference point to cross check those expectations.
Rewards data highlights sustained multi year earnings growth of 27.6% a year and forecast earnings growth around 10.3% per year, which helps explain why some investors accept higher than average multiples.
However, with the share price above the DCF fair value and above the 329.64 analyst target mentioned in the analysis data, the bar for future execution and cash generation implied by those narratives is set quite high.
Revenue growth profile contrasts with pipeline ambitions
Trailing 12 month revenue sits at US$26.2b, and forecasts in the analysis data point to revenue growth of about 4.4% per year, which is much more moderate than the bullish narrative that assumes revenue growth above 60% per year over the next three years.
Bullish commentary leans heavily on a record pipeline of over 596,000 rooms and nearly 260 million Bonvoy members to argue for strong fee based revenue expansion. However, the more modest 4.4% forecast revenue growth and 9.5% recent earnings growth show a gap between current trends and those aggressive pipeline assumptions.
Supporters of the bullish view can point to the large under construction pipeline and growth in co branded credit card fees as ingredients that are not yet fully visible in the trailing revenue figures.
On the other hand, the risk data mentions that debt is not well covered by operating cash flow, so scaling that pipeline into earnings while also improving coverage is an execution challenge the historical numbers do not yet address.
Next Steps
To see how these results tie into long-term growth, risks, and valuation, check out the full range of community narratives for Marriott International on Simply Wall St. Add the company to your watchlist or portfolio so you'll be alerted when the story evolves.
See the numbers differently? If this data points you in another direction, use that perspective to shape your own story in just a few minutes with Do it your way
A great starting point for your Marriott International research is our analysis highlighting 2 key rewards and 3 important warning signs that could impact your investment decision.
See What Else Is Out There
Marriott’s premium P/E of 37.1x, 9.9% net margin and flagged debt coverage concerns point to rich pricing without clear support from current profitability and balance sheet strength.
If that mix of high expectations and balance sheet questions makes you uneasy, you may want to shift your focus toward solid balance sheet and fundamentals stocks screener (45 results) that prioritise financial resilience and help reduce reliance on a single premium name.
This article by Simply Wall St is general in nature. We provide commentary based on historical data and analyst forecasts only using an unbiased methodology and our articles are not intended to be financial advice. It does not constitute a recommendation to buy or sell any stock, and does not take account of your objectives, or your financial situation. We aim to bring you long-term focused analysis driven by fundamental data. Note that our analysis may not factor in the latest price-sensitive company announcements or qualitative material. Simply Wall St has no position in any stocks mentioned.