Marsh & McLennan Companies (MRSH) has wrapped up FY 2025 with fourth quarter revenue of US$6.6b and basic EPS of US$1.69, alongside net income of US$821m, while the trailing twelve months show revenue of US$27.0b and EPS of US$8.47 anchoring the full year picture. The company has seen quarterly revenue move from US$6.1b in Q4 2024 to US$6.6b in Q4 2025, with basic EPS in those periods at US$1.60 and US$1.69 respectively, presenting a set of results where solid top line scale is paired with earnings that keep margins firmly in focus for investors.
See our full analysis for Marsh & McLennan Companies.
With the headline numbers on the table, the next step is to see how this earnings print lines up with the widely followed narratives around Marsh & McLennan, highlighting where the story is reinforced and where the latest margins and growth trends raise fresh questions.
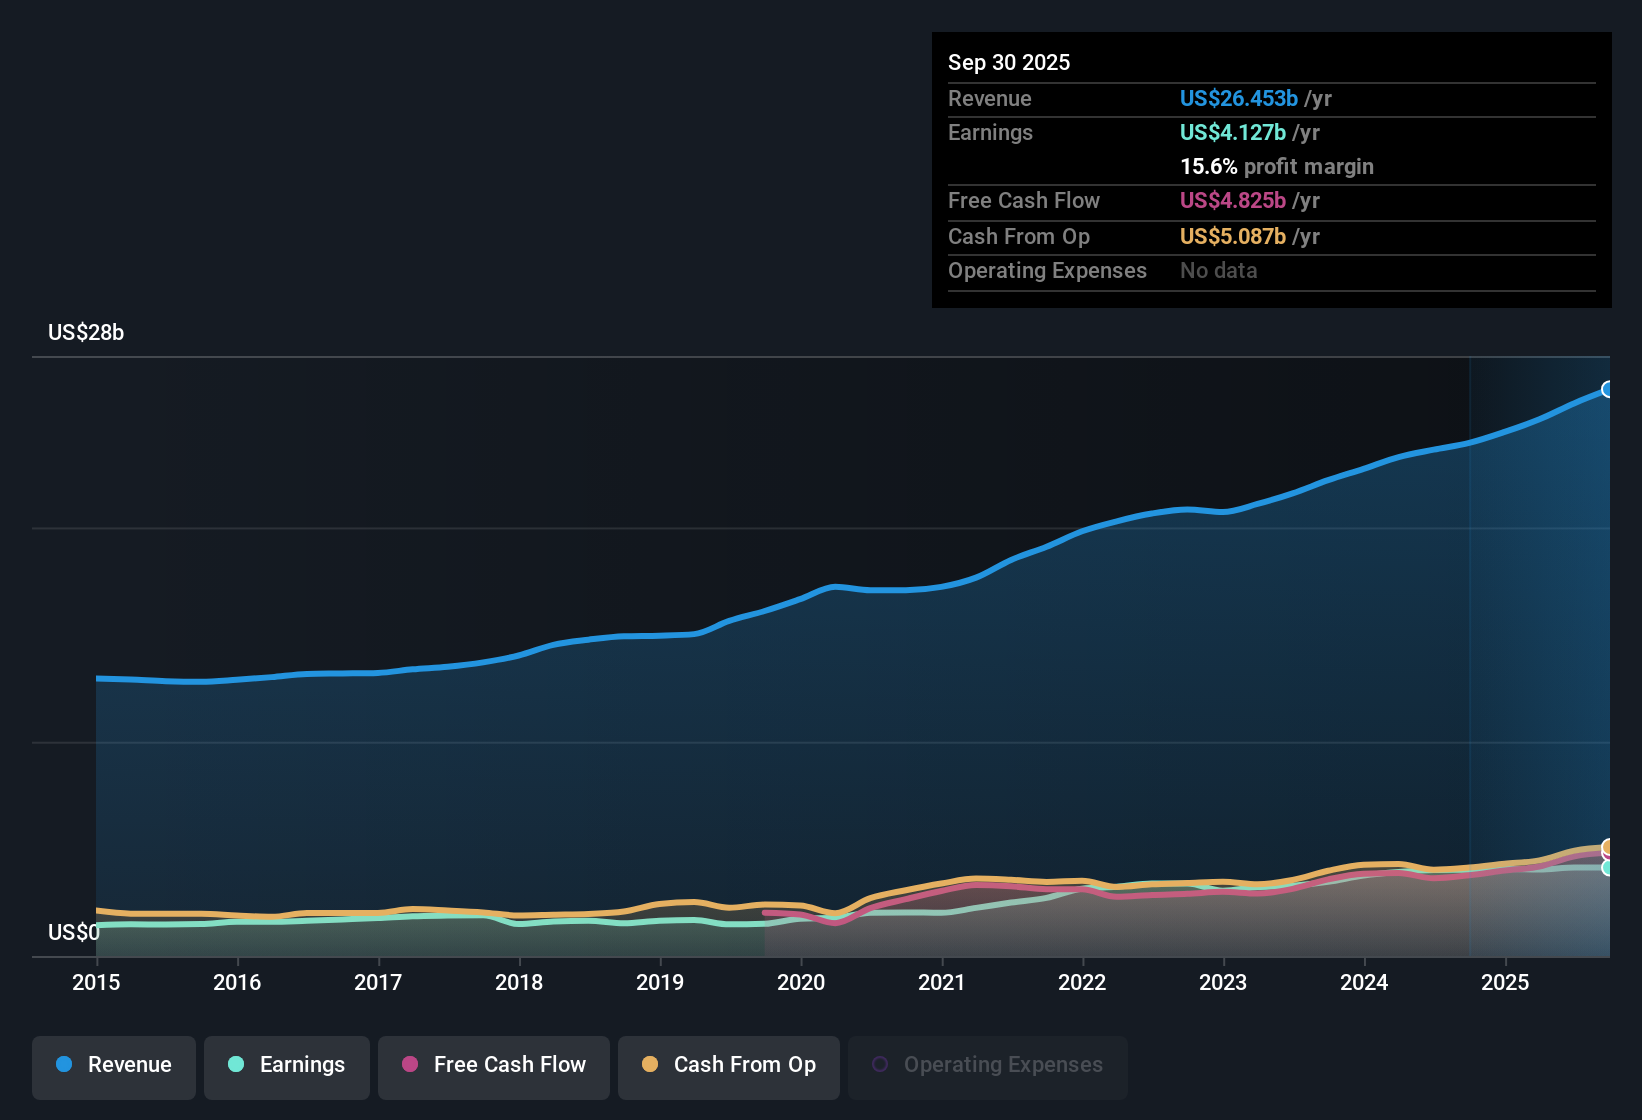
NYSE:MRSH Earnings & Revenue History as at Jan 2026
TTM profits at US$4.2b on slightly lower net margin
On a trailing twelve month basis, Marsh & McLennan earned US$4.2b of net income on US$27.0b of revenue, with the net margin at 15.4% compared with 16.6% a year earlier.
What stands out for the bullish view that emphasizes durable profit growth is that multi year earnings growth of 11.5% a year and forecast growth of 8.74% a year sit alongside this lower 15.4% margin. This means:
Supporters can point to US$4.2b of trailing net income and US$8.47 of TTM EPS as evidence of earnings scale, even with some margin pressure versus the prior 16.6% level.
At the same time, the year over year margin shift reminds you that profit quality is not just about growth rates. It also depends on how efficiently that US$27.0b of revenue is being turned into earnings.
Valuation gap vs US$297.02 DCF fair value
The shares trade at US$187.92 compared with a stated DCF fair value of about US$297.02, and the company on 22.1x P/E is above the US Insurance industry average of 12.8x but below a 26x peer average.
For the bullish narrative that sees room for upside, the numbers offer a mixed scorecard, because:
The roughly 36.7% discount to the US$297.02 DCF fair value and a 1.92% dividend yield back the idea that the current price embeds a degree of caution despite multi year earnings growth of 11.5% a year.
However, the 22.1x P/E that sits above the broader insurance group at 12.8x but below peers at 26x signals that the market is already assigning a quality premium, which can limit how much of that modelled upside is easily realized if revenue growth stays slower than the wider US market.
To see how these valuation signals line up with the wider story on growth, risks, and peer comparisons, check the full consensus take on Marsh & McLennan.
📊 Read the full Marsh & McLennan Companies Consensus Narrative.
Revenue growth steady but trails broader market
Forecast revenue growth of 4.8% a year sits below the 10.6% a year expected for the US market, even though trailing twelve month revenue is US$27.0b compared with US$24.5b a year earlier.
That gap is important for anyone leaning on a more cautious angle, because:
Critics highlight that slower forecast revenue growth at 4.8% a year, alongside a net margin that has eased from 16.6% to 15.4%, may leave less room for upside surprise if cost control or pricing do not offset that pace.
At the same time, the combination of US$27.0b of TTM revenue and US$4.2b of net income means the business is already large and profitable, so concerns about growth need to be weighed against the existing earnings base and the forecast 8.74% annual earnings growth.
Next Steps
Don't just look at this quarter; the real story is in the long-term trend. We've done an in-depth analysis on Marsh & McLennan Companies's growth and its valuation to see if today's price is a bargain. Add the company to your watchlist or portfolio now so you don't miss the next big move.
See What Else Is Out There
Marsh & McLennan pairs a sizeable earnings base with a net margin that has slipped from 16.6% to 15.4% and forecast revenue growth below the wider US market.
If slower growth and some margin pressure leave you wanting a smoother ride, check out CTA_SCREENER_STABLE_GROWTH to focus on companies with more consistent expansion across cycles.
This article by Simply Wall St is general in nature. We provide commentary based on historical data and analyst forecasts only using an unbiased methodology and our articles are not intended to be financial advice. It does not constitute a recommendation to buy or sell any stock, and does not take account of your objectives, or your financial situation. We aim to bring you long-term focused analysis driven by fundamental data. Note that our analysis may not factor in the latest price-sensitive company announcements or qualitative material. Simply Wall St has no position in any stocks mentioned.