MaxLinear (MXL) has wrapped up FY 2025 with fourth quarter revenue of US$136.4 million and a basic EPS loss of US$0.17, alongside a trailing twelve month basic EPS loss of US$1.58 on revenue of US$467.6 million. Over recent periods the company has seen quarterly revenue move from US$81.1 million in Q3 2024 to US$92.2 million in Q4 2024, then to US$95.9 million, US$108.8 million, US$126.5 million, and finally US$136.4 million in Q4 2025. Quarterly basic EPS losses ranged from US$0.90 in Q3 2024 to US$0.68, US$0.58, US$0.31, US$0.52 and US$0.17 across the same stretch. For investors, the latest print highlights a clear tension between top line momentum and still pressured margins, with the path to better profitability squarely in focus.
See our full analysis for MaxLinear.
With the numbers on the table, the next step is to see how this performance lines up with the prevailing MaxLinear narratives, highlighting where the growth story holds up and where persistent losses may challenge expectations.
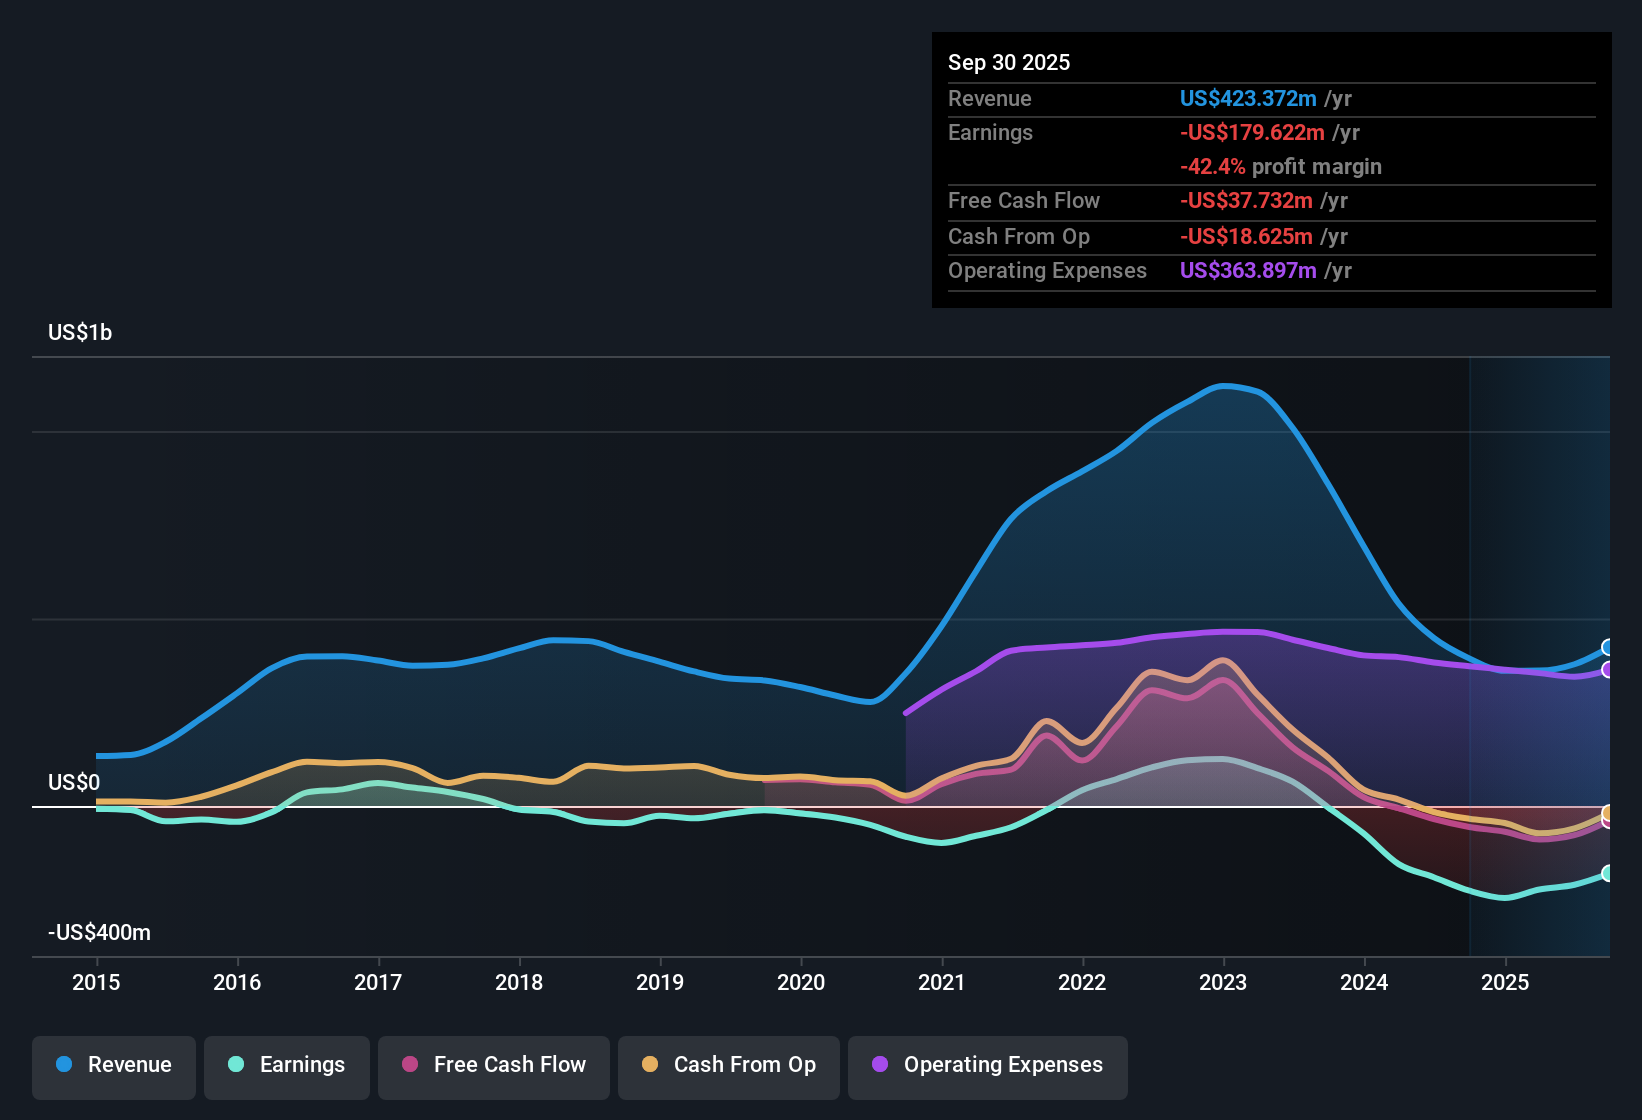
NasdaqGS:MXL Earnings & Revenue History as at Jan 2026
Revenue climbs to US$467.6 million over the year
On a trailing twelve month basis, MaxLinear booked US$467.6 million in revenue, with quarterly revenue moving from US$81.1 million in Q3 2024 to US$136.4 million in Q4 2025, while trailing twelve month revenue increased from US$360.5 million in Q4 2024 to US$467.6 million in Q4 2025.
Supporters of a more bullish angle often focus on the 12.6% forecast annual revenue growth, yet the data shows this is starting from a base where trailing twelve month net income was a loss of US$136.7 million in Q4 2025 and basic EPS over that same period was a loss of US$1.58, so any growth story still has to contend with sizeable losses in the recent record.
Revenue momentum, from US$360.5 million to US$467.6 million on a trailing twelve month view, aligns with the idea of above market growth, but it is paired with loss making operations.
The current share price of US$17.35 sits below the stated DCF fair value of US$25.72, which supports the upside argument on revenue traction, yet profitability metrics do not currently support a clean bullish picture.
Over four straight quarters, rising sales and shrinking EPS losses give bulls something to point to, but the trailing loss of US$136.7 million keeps the story firmly in “prove it” territory for now.
📊 Read the full MaxLinear Consensus Narrative.
Losses narrow, but trailing net loss still US$136.7 million
Quarterly net loss (excluding extra items) moved from US$75.8 million in Q3 2024 to US$14.9 million in Q4 2025, and on a trailing twelve month view the loss narrowed from US$245.2 million in Q4 2024 to US$136.7 million in Q4 2025, with trailing basic EPS moving from a loss of US$2.93 to a loss of US$1.58 over the same span.
Bears highlight the major risk that MaxLinear remains unprofitable and is not forecast to achieve profitability within the next three years, and the trailing figures back up that concern even with recent quarterly improvements.
The five year track record of losses growing at about 42.1% a year, combined with a current trailing twelve month net loss of US$136.7 million, shows that the path to break even has not yet been established in the historical numbers provided.
Even with Q4 2025 net loss reduced to US$14.9 million compared with earlier quarterly losses of more than US$45 million in FY 2025, the company is still loss making over the year and margins remain negative according to the summary.
Bears argue that a trailing loss of US$136.7 million and a multi year pattern of widening losses make profitability the central hurdle for this stock.
🐻 MaxLinear Bear Case
P/S of 3.2x sits between industry and peer benchmarks
MaxLinear’s P/S ratio of 3.2x is lower than the US Semiconductor industry average of 5.8x, flagged as good value versus the industry, while it is higher than the peer average of 2.4x, flagged as more expensive compared with closer comparables.
What stands out for valuation focused investors is the tension between a P/S discount to the wider industry and a premium to peers, paired with a current price of US$17.35 that sits about 32.6% below the stated DCF fair value of US$25.72, which means the valuation case leans on the idea that the 12.6% forecast revenue growth eventually interacts with the current loss making profile in a way that supports higher multiples.
The mix of a 3.2x P/S below the 5.8x industry average and a trailing twelve month loss of US$136.7 million shows that the market is not pricing MaxLinear like the more highly valued semiconductor names, while still assigning a richer multiple than the 2.4x peer group.
The suggested 32.6% gap between the share price and
Next Steps
Don't just look at this quarter; the real story is in the long-term trend. We've done an in-depth analysis on MaxLinear's growth and its valuation to see if today's price is a bargain. Add the company to your watchlist or portfolio now so you don't miss the next big move.
Explore Alternatives
MaxLinear’s multi year pattern of sizeable losses, with a trailing twelve month net loss of US$136.7 million and negative EPS, keeps profitability as the key concern.
If you want companies where profits and cash positions are already doing the heavy lifting, check out our 1044 pre-screened stocks with net cash and a strong growth track record to focus on businesses pairing financial strength with a growth track record.
This article by Simply Wall St is general in nature. We provide commentary based on historical data and analyst forecasts only using an unbiased methodology and our articles are not intended to be financial advice. It does not constitute a recommendation to buy or sell any stock, and does not take account of your objectives, or your financial situation. We aim to bring you long-term focused analysis driven by fundamental data. Note that our analysis may not factor in the latest price-sensitive company announcements or qualitative material. Simply Wall St has no position in any stocks mentioned.