
Please use a PC Browser to access Register-Tadawul
Get It
Medtronic Shares Trade Near Fair Value After Strong Start to 2025
Medtronic Plc MDT | 97.42 | -1.17% |
If you are sizing up your next move with Medtronic, you are not alone. Plenty of investors are eyeing this healthcare giant as it navigates a complex market landscape, weighing questions about growth and value. Recently, Medtronic’s share price has been on a modest but steady incline, up 1.2% over the past week and 1.1% in the last month. More notably, this year’s trend is clearly positive, with the stock up 17.2% since January. These gains, while sometimes overshadowed by broader market jitters, hint at renewed confidence and shifting risk perceptions around the stock. Over the past year, Medtronic has returned 7.9%, with a 3-year gain of 15.1% and a positive, though muted, five-year increase of 1.1%.
Behind these movements are several factors, including a stream of market developments in medical innovation and evolving investor sentiment. For those of us trying to determine if Medtronic offers true value at its current share price of $94.03, it helps to step back and look at the numbers. Using a set of six valuation checks, Medtronic scores a solid 4 out of 6 for being undervalued. That is a positive signal, suggesting the stock may not be fully appreciated in the market right now.
Let’s break down exactly what those valuation checks are, how Medtronic measures up by traditional standards, and why the best way to judge the company’s worth might go beyond just the numbers.
Medtronic delivered 7.9% returns over the last year. See how this stacks up to the rest of the Medical Equipment industry.A Discounted Cash Flow (DCF) model estimates a company's intrinsic value by forecasting its future cash flows and discounting them back to today's dollars, reflecting the time value of money. This approach attempts to quantify what Medtronic is truly worth based on its ability to generate cash in the years ahead.
For Medtronic, the model starts with its most recent Free Cash Flow of $5.41 Billion. Analyst estimates suggest steady annual growth, with Free Cash Flow projected to reach approximately $6.94 Billion by 2028. Looking further ahead, and incorporating both analyst and market-sourced projections, the company could be generating nearly $8.94 Billion in Free Cash Flow by 2035, all values expressed in US dollars.
Factoring in these cash flows and appropriately discounting for future uncertainty, the DCF model calculates an intrinsic value of $97.18 per share for Medtronic. With the current share price at $94.03, this suggests the stock is about 3.2% undervalued. Since this difference falls below the 10% threshold, Medtronic's shares are trading very close to fair value, neither a bargain nor clearly overpriced at this point.
Result: ABOUT RIGHT
Head to the Valuation section of our Company Report for more details on how we arrive at this Fair Value for Medtronic.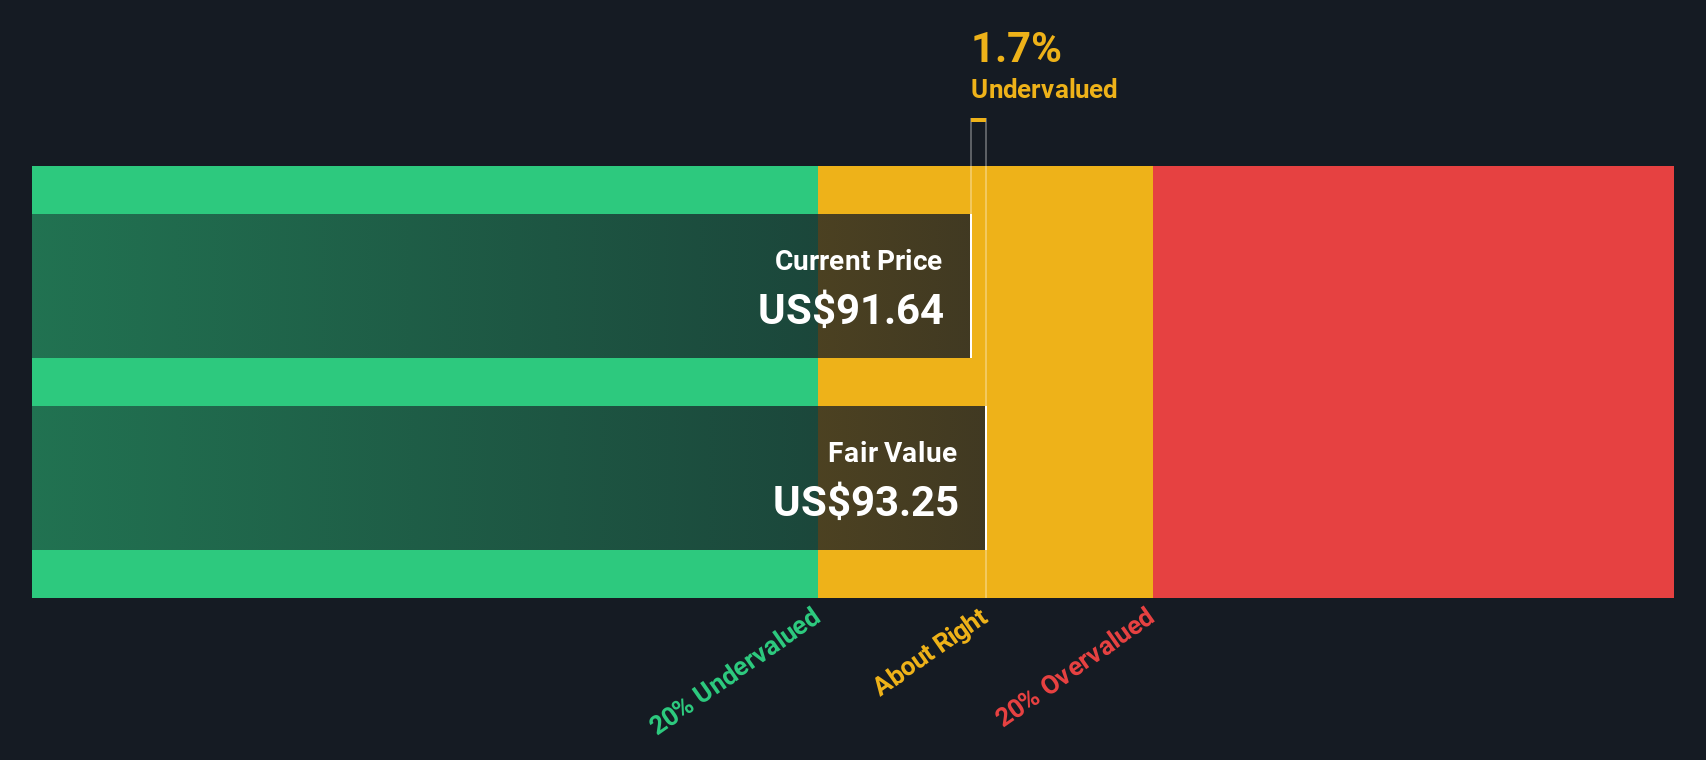
The Price-to-Earnings (PE) ratio stands out as a key valuation metric for mature, profitable companies like Medtronic because it directly links the company's market value to its earnings power. For investors, a company's PE ratio offers a quick way to assess how much they are paying for every dollar of current profits.
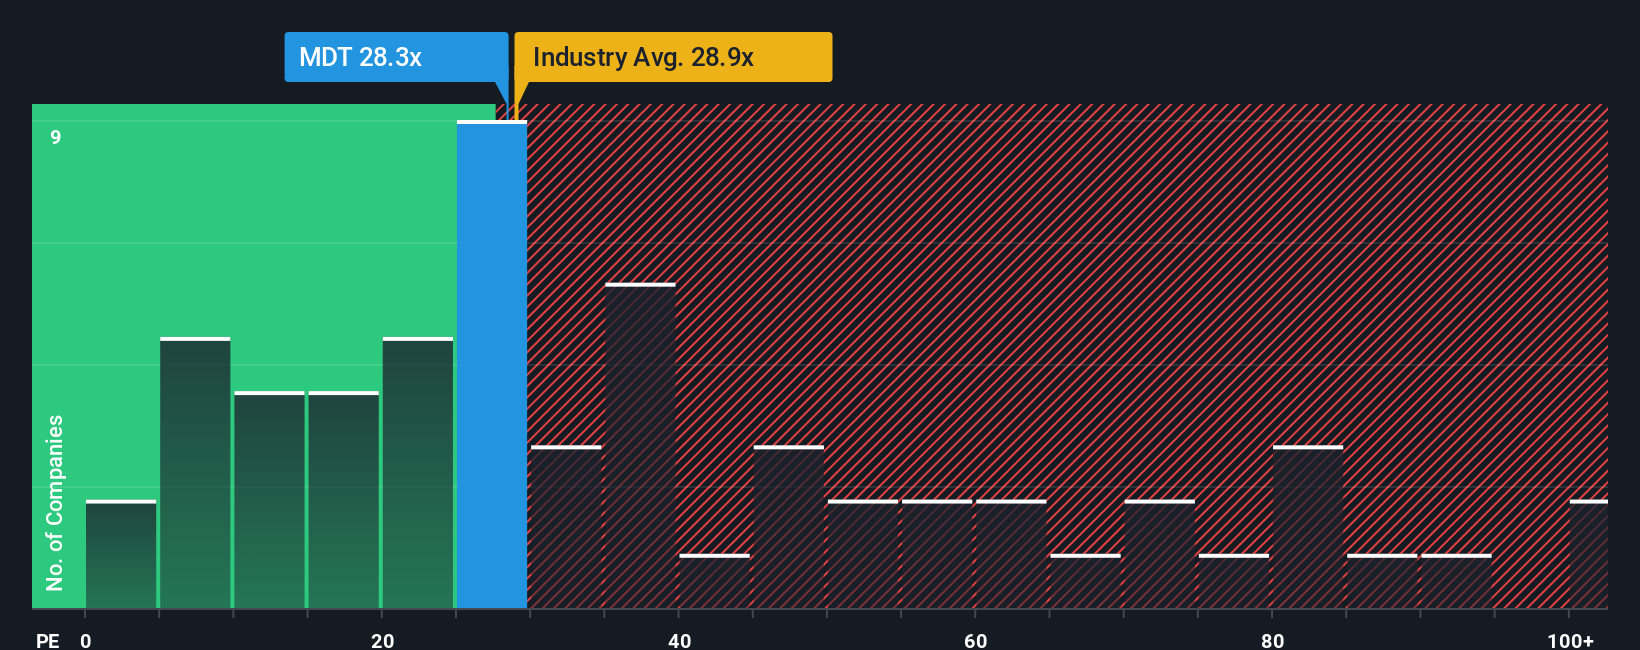
Growth expectations and risk play a major role in determining what constitutes a “normal” or “fair” PE ratio. Fast-growing businesses often warrant higher PEs, while companies facing greater uncertainty or weaker prospects trade at lower multiples. For Medtronic, the current PE ratio sits at 25.9x. This is just below the Medical Equipment industry average of 29.1x, and well below the peer group average of 47.4x. This suggests the stock is not commanding a significant growth premium relative to competitors.
However, benchmarks like the industry or peer average do not tell the whole story. Simply Wall St’s proprietary "Fair Ratio" estimates the right PE for Medtronic at 27.5x, factoring in the company’s unique mix of earnings growth, profit margins, market cap, industry trends, and risk profile. This more holistic approach gives investors a tailored yardstick, rather than a one-size-fits-all comparison.
With Medtronic’s current PE only modestly below its Fair Ratio, the stock appears to be priced very close to what its underlying fundamentals would justify.
Result: ABOUT RIGHT
Earlier we mentioned that there's an even better way to understand valuation, so let's introduce you to Narratives. A Narrative is your unique story about a company, including how you see its future, how you forecast its revenue, earnings, and profit margins, and what you believe its fair value should be, based on your perspective. Narratives link Medtronic’s business story directly to a custom financial forecast and then automatically calculate a fair value that is personal to your outlook.
Simply Wall St makes Narratives easy and accessible for everyone, with millions of investors already sharing and comparing Narratives every day on the Community page. By exploring (or building) Narratives, you can see not just what the market thinks, but why, and decide when to buy or sell as you compare your calculated Fair Value against the current Price. Best of all, Narratives are dynamic because whenever new news or earnings are released, your numbers and signals update right away, keeping your story relevant.
For example, users' Narratives for Medtronic currently range from a bullish price target of $112, based on innovation and margin improvements, to a cautious $82, reflecting concerns about execution risks. This demonstrates just how dynamic and personalized investment decisions can be.
Do you think there's more to the story for Medtronic? Create your own Narrative to let the Community know!
This article by Simply Wall St is general in nature. We provide commentary based on historical data and analyst forecasts only using an unbiased methodology and our articles are not intended to be financial advice. It does not constitute a recommendation to buy or sell any stock, and does not take account of your objectives, or your financial situation. We aim to bring you long-term focused analysis driven by fundamental data. Note that our analysis may not factor in the latest price-sensitive company announcements or qualitative material. Simply Wall St has no position in any stocks mentioned.
