Nurix Therapeutics (NRIX) closed out FY 2025 with Q4 revenue of US$13.6 million and a basic EPS loss of US$0.82, while the trailing twelve months show revenue of US$84.0 million and a basic EPS loss of US$3.05. Over recent periods, the company has seen quarterly revenue range from US$7.9 million to US$44.1 million and basic EPS losses move between US$0.52 and US$1.03 per quarter. This sets the backdrop for what remains an early stage, loss making biotech story. For investors, the key question from this update is whether revenue traction can eventually support healthier margins and narrow the gap between top line progress and ongoing losses.
See our full analysis for Nurix Therapeutics.
With the headline numbers on the table, the next step is to see how this latest print lines up against the key narratives around Nurix, both on its growth potential and on the pressure that continued losses put on margins.
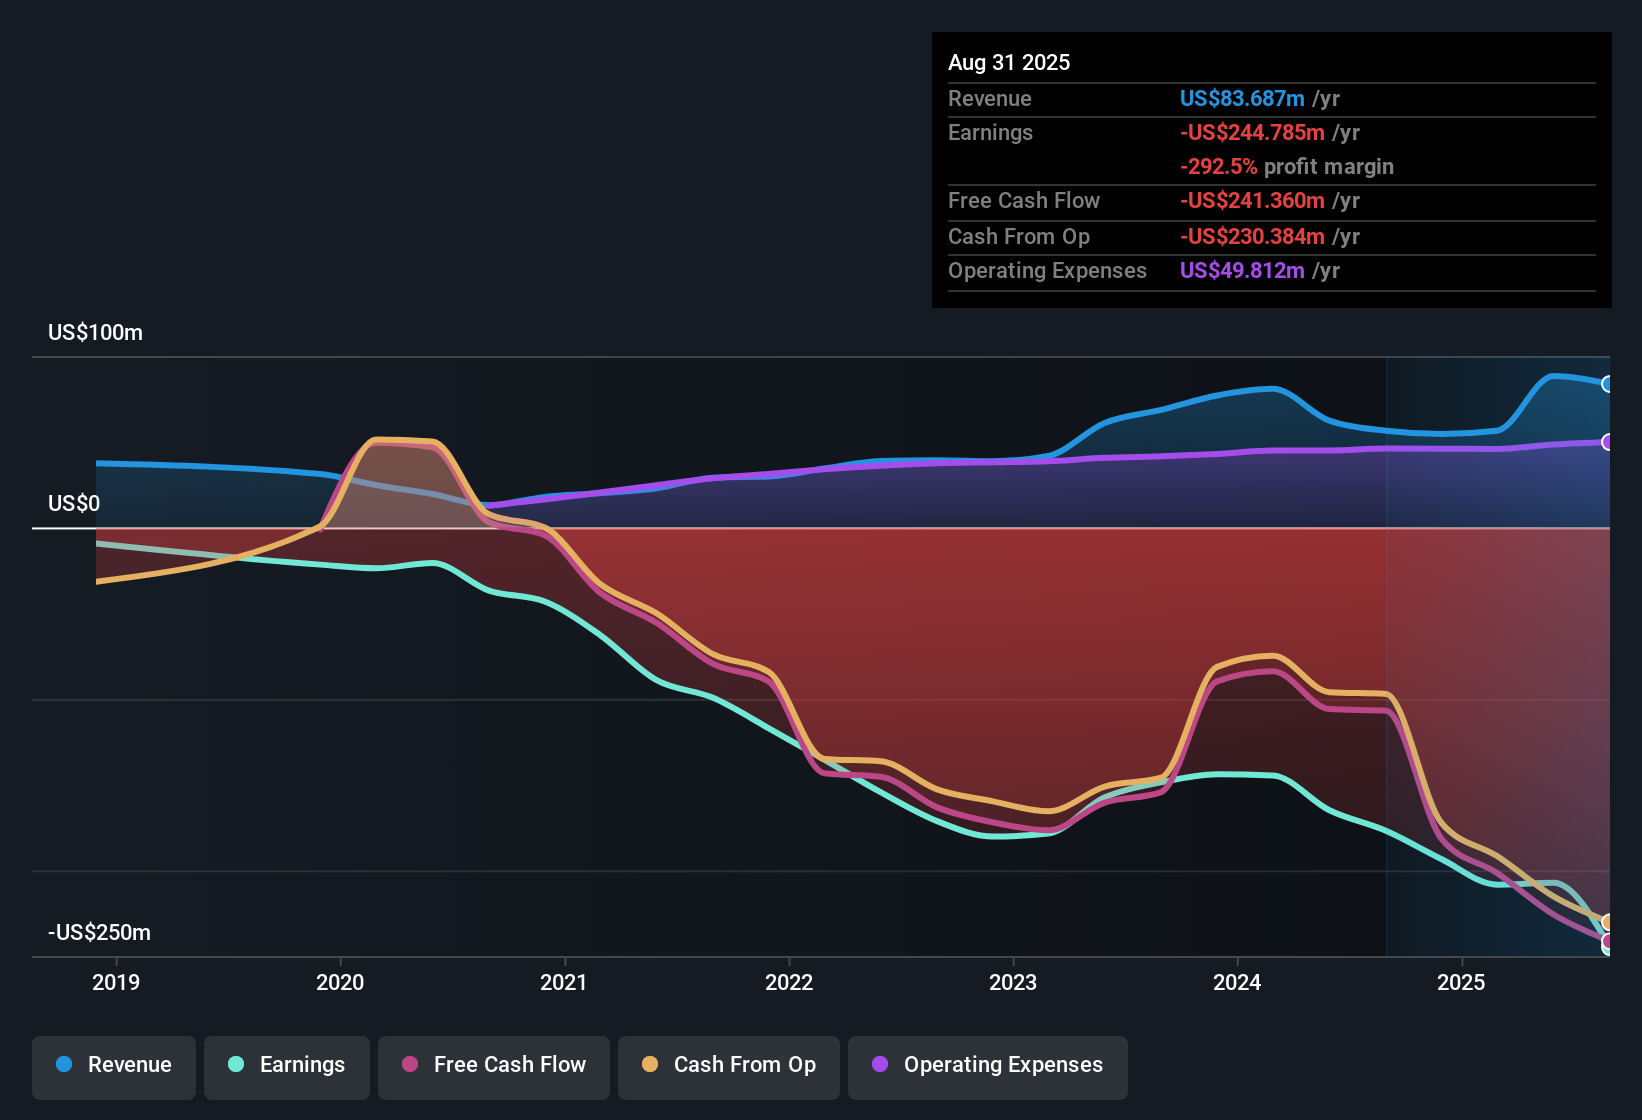
NasdaqGM:NRIX Earnings & Revenue History as at Jan 2026
US$264.5 million annual loss keeps profitability distant
On a trailing twelve month basis, Nurix booked US$83.98 million in revenue against a net loss of US$264.46 million and a basic EPS loss of US$3.05, showing that expenses are still far ahead of what the business is bringing in.
Bears focus on this gap between revenue and losses, and the data supports their concern that profitability is not close, as losses have grown at about 20.2% per year over the past five years and forecasts suggest the company is not expected to be profitable over the next three years.
That long running increase in losses sits alongside continued negative EPS in every recent quarter, including a Q4 loss of US$78.22 million, which backs up the cautious view.
Even in the strongest recent revenue quarter, with US$44.06 million of revenue, the company still reported a net loss of US$43.46 million, which critics argue supports the idea that the current business scale does not yet cover its cost base.
Revenue outlook of 39.45% a year versus ongoing losses
Revenue is forecast in the data to grow at about 39.45% per year, compared to a cited 10.6% per year for the US market, while the company remains loss making over the trailing twelve months with US$264.46 million in net losses.
Bullish investors often point to that 39.45% forecast revenue growth as a key attraction, and the figures give them some support but also a clear hurdle, because the revenue base of US$83.98 million on a trailing basis is still much smaller than the trailing loss figure of US$264.46 million.
Supporters highlight that over the last four reported quarters, revenue ranged from US$7.89 million to US$44.06 million, which they see as early signs of commercial traction alongside multiple Phase I programs.
At the same time, the trailing EPS loss of US$3.05 and the expectation that losses continue for at least three years mean the bullish case relies on that forecast revenue growth eventually translating into much better cost absorption than the current numbers show.
📊 Read the full Nurix Therapeutics Consensus Narrative.
Rich 21.5x P/S multiple and recent dilution
The stock is described as trading on a P/S of 21.5x, compared with 11.5x for the US biotech industry and 10.4x for peers, and shareholders also saw material dilution over the past year according to the risk summary.
What stands out for more cautious investors is how this higher 21.5x P/S sits alongside continuing losses and dilution, because the company has not yet reached profitability on US$83.98 million of trailing revenue and has recorded a US$264.46 million trailing loss, so bears argue the current multiple already bakes in a lot of the 39.45% revenue growth that is referenced in the forecasts.
Critics also point to the basic EPS loss of US$3.05 over the trailing twelve months and the history of losses growing at about 20.2% per year as reasons to question whether such a valuation level is justified without clearer evidence of cost discipline.
Against that, some investors see the higher multiple as a reflection of the growth outlook and pipeline, but the combination of dilution, negative EPS and a P/S premium means the valuation case heavily depends on the company eventually converting that forecast revenue growth into a smaller loss profile than the trailing US$264.46 million.
Next Steps
Don't just look at this quarter; the real story is in the long-term trend. We've done an in-depth analysis on Nurix Therapeutics's growth and its valuation to see if today's price is a bargain. Add the company to your watchlist or portfolio now so you don't miss the next big move.
See What Else Is Out There
Nurix is still posting sizeable net losses of US$264.46 million against US$83.98 million of revenue, with continued negative EPS and recent shareholder dilution.
If that mix of steep losses and a rich 21.5x P/S multiple makes you cautious, check out these 869 undervalued stocks based on cash flows to zero in on companies where current pricing looks more grounded in the underlying numbers.
This article by Simply Wall St is general in nature. We provide commentary based on historical data and analyst forecasts only using an unbiased methodology and our articles are not intended to be financial advice. It does not constitute a recommendation to buy or sell any stock, and does not take account of your objectives, or your financial situation. We aim to bring you long-term focused analysis driven by fundamental data. Note that our analysis may not factor in the latest price-sensitive company announcements or qualitative material. Simply Wall St has no position in any stocks mentioned.