Okta (OKTA) Valuation Check As India Data Residency Expansion Gains Traction
Okta, Inc. Class A OKTA | 80.19 | +1.32% |
Okta’s India push and what it could mean for investors
Okta (OKTA) has just rolled out in-country platform tenants in India. The company aims to meet local data residency rules while supporting AI adoption in heavily regulated sectors such as banking and healthcare.
For investors, this move links Okta’s identity security fabric directly to India’s data protection framework and AI ambitions. In-country hosting on AWS is positioned to address compliance, cyber risk, and disaster recovery needs.
Okta shares trade at US$88.94 after a 1.4% one day share price gain. However, the 7 day and 30 day share price returns are 4.72% and 2.2% declines. The year to date share price return of 6.34% contrasts with a 0.36% one year total shareholder return and a 30.87% three year total shareholder return, alongside a 64.61% five year total shareholder return decline. This suggests that near term momentum has picked up slightly even as longer term returns have been mixed.
If Okta’s move into India has you thinking about where identity and AI might go next, it could be a useful moment to scan high growth tech and AI stocks for other potential ideas.
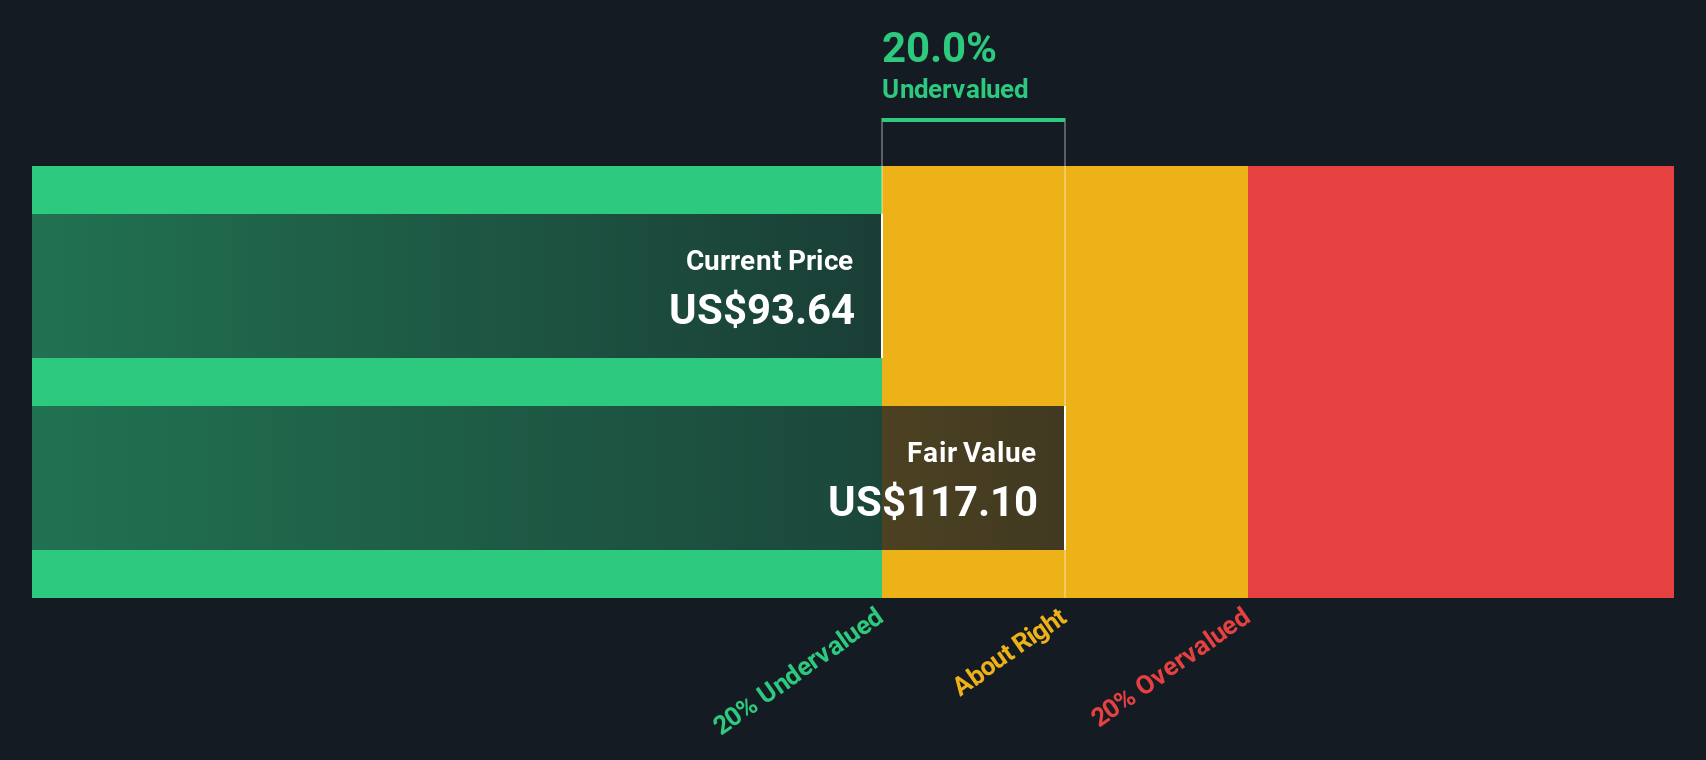
With Okta trading at US$88.94, sitting on mixed long term returns, a value score of 2 and a quoted 28% intrinsic discount, you have to ask: is this a genuine mispricing, or is the market already baking in future growth?
Price-to-Earnings of 80.8x: Is it justified?
With Okta closing at US$88.94 and trading on a P/E of 80.8x, the shares sit well above both peer and industry averages, even after factoring in recent returns.
P/E compares the share price to earnings per share, so a higher P/E usually means the market is pricing in stronger profit growth or a higher quality earnings stream.
Okta has recently turned profitable and is forecast to grow earnings by 19% per year, which helps explain why investors might be willing to pay a higher multiple. However, our DCF work suggests a future cash flow value of US$123.37 per share, and Okta is also flagged as trading at 27.9% below that estimate of fair value, which contrasts with the rich P/E headline.
Against the US IT industry average P/E of 27.6x and a peer average of 30.4x, Okta at 80.8x stands out as materially more expensive, implying the market is assigning it a premium that could compress if expectations change.
Result: Price-to-Earnings of 80.8x (OVERVALUED)
However, investors still face real risks, including the possibility that Okta’s high P/E compresses if sentiment cools, or that execution in India proves slower than hoped.
Another view on Okta’s value
While the 80.8x P/E makes Okta look expensive, our DCF model points the other way, with a future cash flow value of US$123.37 per share versus today’s US$88.94. That gap suggests the market might be pricing earnings cautiously. The key question is which signal you trust more: the high multiple or the cash flow math?
Simply Wall St performs a discounted cash flow (DCF) on every stock in the world every day (check out Okta for example). We show the entire calculation in full. You can track the result in your watchlist or portfolio and be alerted when this changes, or use our stock screener to discover 881 undervalued stocks based on their cash flows. If you save a screener we even alert you when new companies match - so you never miss a potential opportunity.
Build Your Own Okta Narrative
If you look at this and feel differently, or just want to stress test the assumptions yourself, you can spin up your own view in minutes with Do it your way.
A good starting point is our analysis highlighting 3 key rewards investors are optimistic about regarding Okta.
Looking for more investment ideas?
If Okta has sparked your interest, do not stop here. The Screener can surface other angles you might be missing across different themes and return profiles.
- Spot early stage opportunities that still meet solid financial criteria by checking out these 3534 penny stocks with strong financials before they get crowded.
- Zero in on companies tied to AI growth by scanning these 23 AI penny stocks and see which names fit your thesis on data and automation.
- Hunt for potential mispricings by reviewing these 881 undervalued stocks based on cash flows and compare their fundamentals with what you are seeing in Okta.
This article by Simply Wall St is general in nature. We provide commentary based on historical data and analyst forecasts only using an unbiased methodology and our articles are not intended to be financial advice. It does not constitute a recommendation to buy or sell any stock, and does not take account of your objectives, or your financial situation. We aim to bring you long-term focused analysis driven by fundamental data. Note that our analysis may not factor in the latest price-sensitive company announcements or qualitative material. Simply Wall St has no position in any stocks mentioned.