
Please use a PC Browser to access Register-Tadawul
Get It
PACS Group (PACS) Valuation Check After Leadership Hires Strong Growth And Renewed Analyst Confidence
PACS Group, Inc. PACS | 38.68 | +0.13% |
PACS Group (PACS) is back in focus after recent leadership appointments, improved internal controls following an audit, and renewed analyst confidence. Together, these developments are shaping fresh investor interest in the stock.
Those leadership and governance updates have arrived while the stock has been on a strong run, with a 30 day share price return of 18.63% and a 90 day share price return of 232.82%, contributing to a 1 year total shareholder return of 221.67% at a recent share price of $41.27. This points to momentum that has been building rather than fading.
If PACS Group’s recent move has caught your attention, it could be a good moment to see what else is happening across healthcare by scanning healthcare stocks.
With PACS Group now trading near its recent high and the average analyst price target of $44.20 only modestly above the current US$41.27 level, is there still a buying opportunity here or is the market already pricing in future growth?
On a headline basis, PACS Group’s current US$41.27 share price lines up with a P/E of 38.2x, which screens as expensive against both its peers and the wider US Healthcare industry.
The P/E multiple compares the current share price to earnings per share, so it effectively shows how many dollars investors are paying for one dollar of recent earnings. For a company operating skilled nursing, assisted living, senior care and independent living facilities, this is a common way investors weigh current profitability against expectations for future earnings.
In this case, the market is assigning a higher price tag than both the peer average P/E of 19x and the industry average of 22.9x. This suggests investors are paying a premium for PACS Group’s earnings profile. Our fair P/E estimate of 30.7x also sits well below the current 38.2x level, which indicates a valuation that is rich even relative to where the ratio could trend if sentiment cooled.
When compared with healthcare peers on 22.9x and a peer group closer to 19x, PACS Group’s 38.2x P/E stands out as significantly higher. It is also above the 30.7x fair P/E level that the market could potentially gravitate toward over time as expectations reset.
Result: Price-to-Earnings of 38.2x (OVERVALUED)
However, this premium P/E could be vulnerable if revenue growth of 8.68% or net income growth of 32.22% slows, or if analyst expectations near the US$44.20 target weaken.
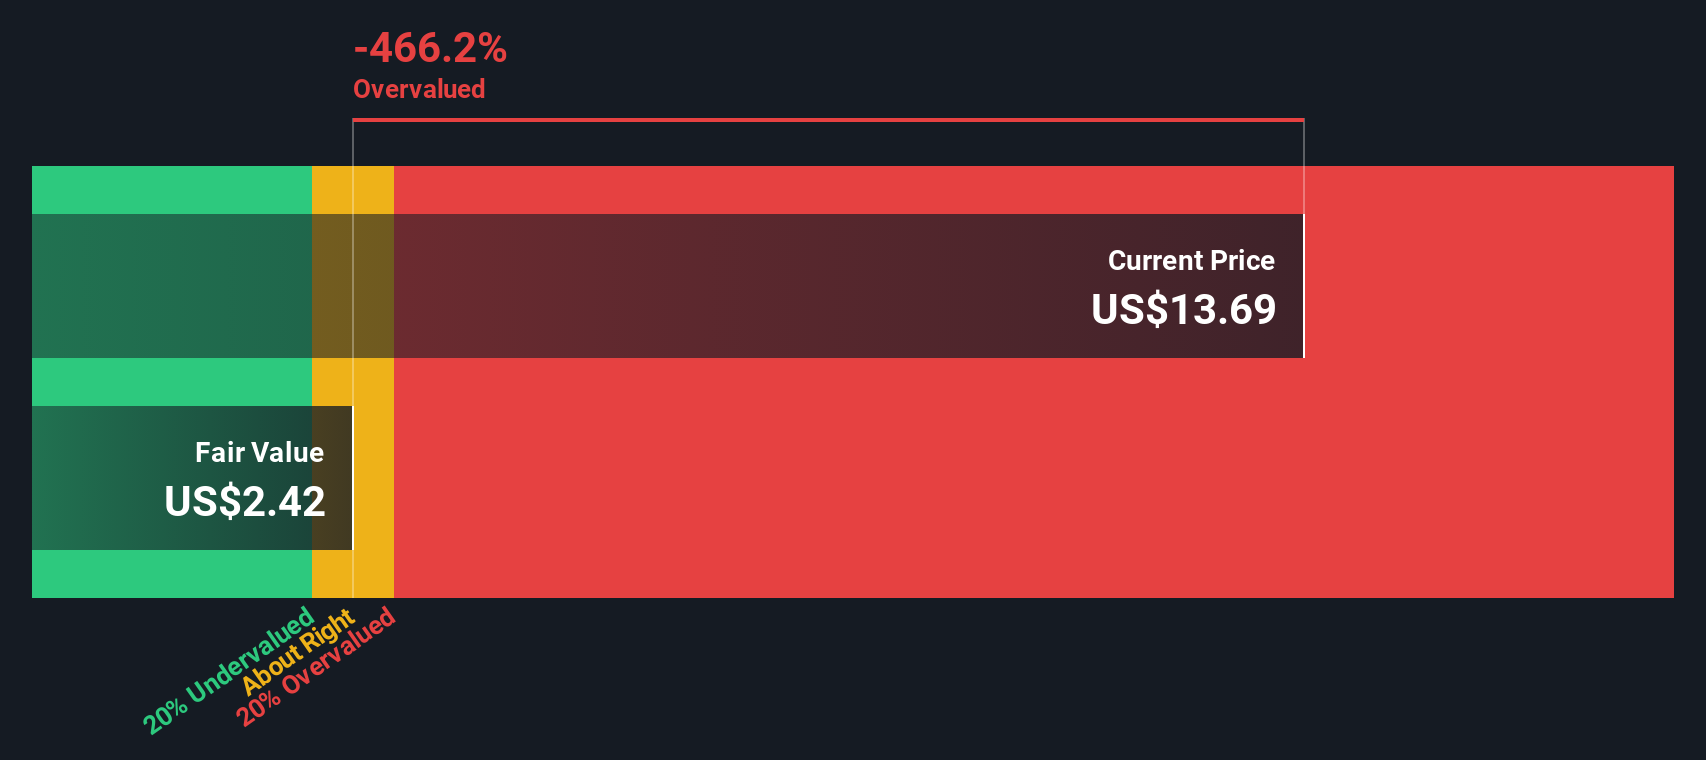
While the P/E of 38.2x suggests PACS Group is expensive, the SWS DCF model goes further. It points to a fair value estimate of US$4.59 per share versus the current US$41.27 price, which screens as very overvalued using this method. That raises a clear question: is the market looking past the cash flow math?
Simply Wall St performs a discounted cash flow (DCF) on every stock in the world every day (check out PACS Group for example). We show the entire calculation in full. You can track the result in your watchlist or portfolio and be alerted when this changes, or use our stock screener to discover 882 undervalued stocks based on their cash flows. If you save a screener we even alert you when new companies match - so you never miss a potential opportunity.
If you see the numbers differently or simply want to test your own view against the data, you can build a custom PACS Group story in a few minutes, starting with Do it your way.
A great starting point for your PACS Group research is our analysis highlighting 2 key rewards and 2 important warning signs that could impact your investment decision.
If PACS Group has you thinking more broadly about your portfolio, this is the moment to widen your search before the next wave of opportunities moves ahead.
This article by Simply Wall St is general in nature. We provide commentary based on historical data and analyst forecasts only using an unbiased methodology and our articles are not intended to be financial advice. It does not constitute a recommendation to buy or sell any stock, and does not take account of your objectives, or your financial situation. We aim to bring you long-term focused analysis driven by fundamental data. Note that our analysis may not factor in the latest price-sensitive company announcements or qualitative material. Simply Wall St has no position in any stocks mentioned.
