Rambus (RMBS) closed out FY 2025 with Q4 revenue of US$190.2 million and basic EPS of US$0.59, alongside net income excluding extra items of US$63.8 million. Over the last six quarters in the data, revenue has ranged from US$145.5 million to US$190.2 million while basic EPS moved between US$0.45 and US$0.59, with trailing 12 month EPS at US$2.14 on revenue of US$707.6 million. With a trailing net profit margin of 32.6%, the latest numbers keep the focus squarely on how sustainably Rambus is turning top line performance into earnings power.
See our full analysis for Rambus.
With the latest earnings now on the table, the next step is to see how these figures line up with the widely followed growth and profitability stories around Rambus, and where those narratives might need updating.
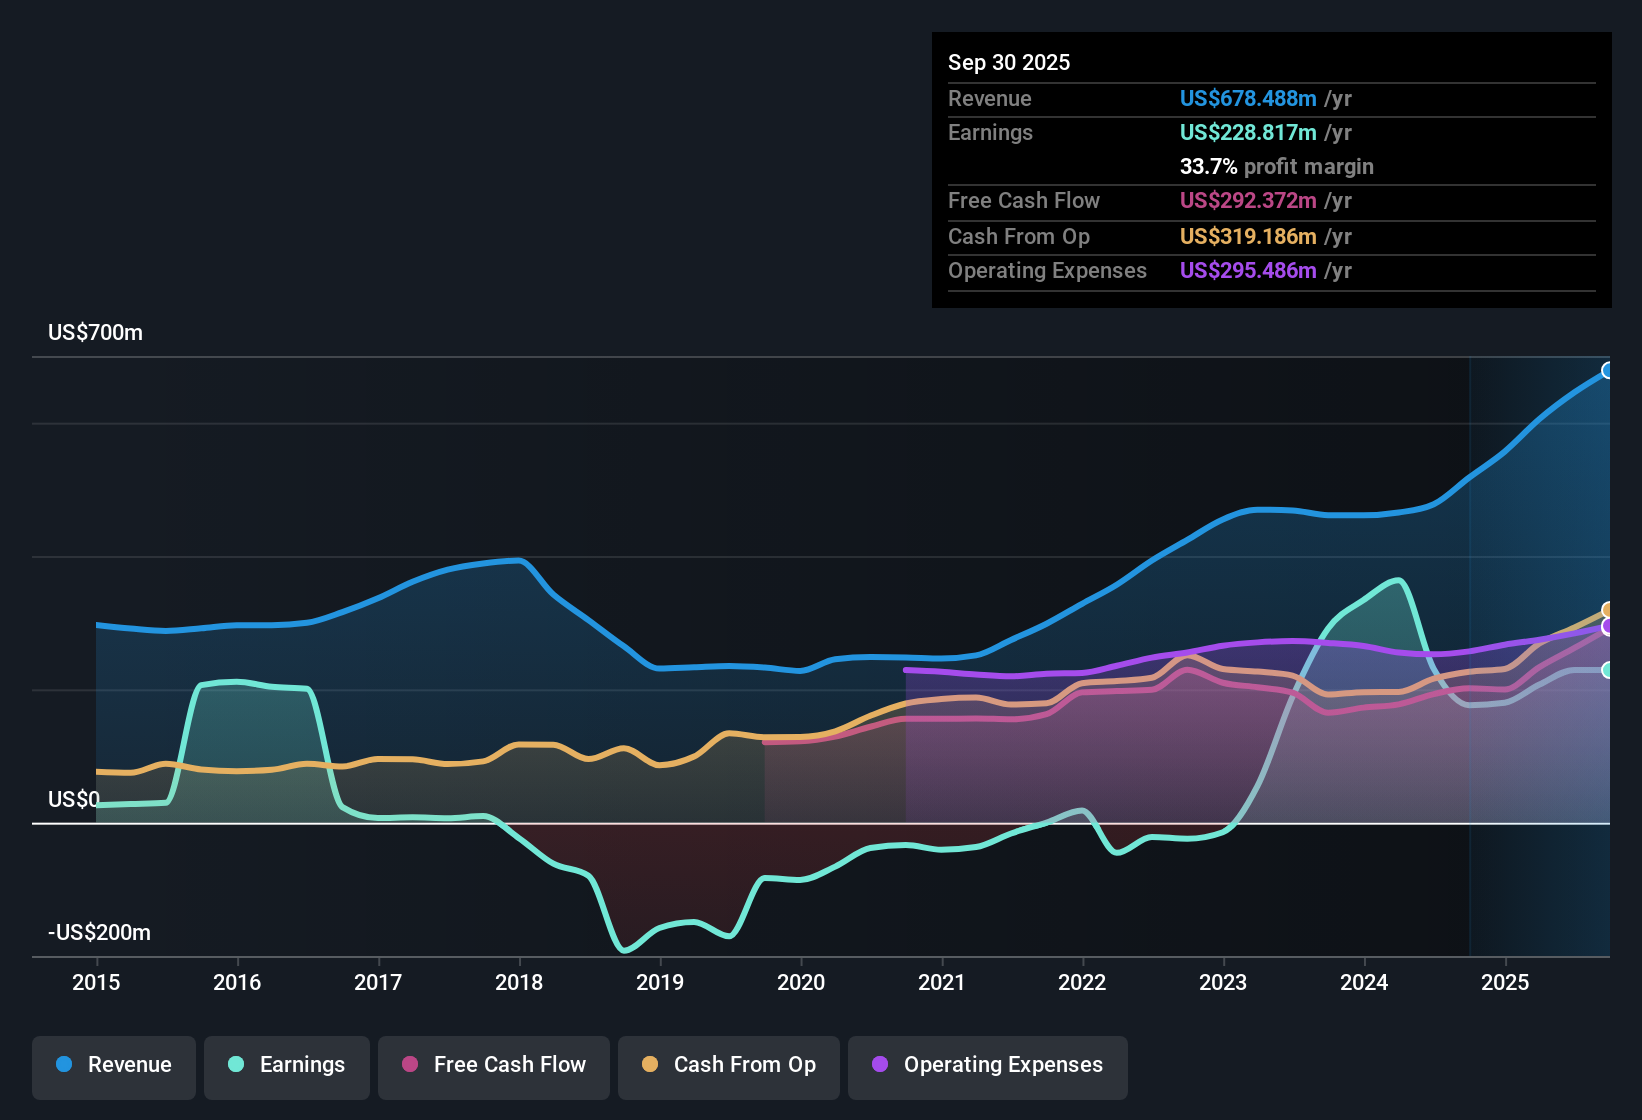
NasdaqGS:RMBS Earnings & Revenue History as at Feb 2026
TTM earnings of US$230.5 million back a high-margin profile
On a trailing twelve month basis, Rambus reported US$707.6 million of revenue and US$230.5 million of net income excluding extra items, which lines up with the reported 32.6% net margin.
What bullish investors often focus on is that earnings grew 28.2% over the last year and are forecast around 20.4% per year, and this view is heavily supported by the step up in trailing EPS from US$1.67 to US$2.14 and net income from US$179.8 million to US$230.5 million across the reported periods.
Those same bulls can also point to revenue rising from US$556.6 million to US$707.6 million over the trailing periods cited, alongside margins holding near 32% in both years.
Together, that combination of higher trailing revenue and earnings with a similar margin level is often used to argue that recent profit levels are grounded in the current business mix rather than one-off items.
Over the last twelve months, Rambus kept profit margins around 32% while lifting EPS and net income, which is exactly the sort of operating backdrop bullish analysts like to build their case around.
📊 Read the full Rambus Consensus Narrative.
Premium 46x P/E versus peers and DCF fair value
The shares trade on a trailing P/E of about 46x at a price of US$98.45, compared with a peer average of 33.9x and a semiconductor industry average of 42.2x, while the cited DCF fair value is US$70.59.
Critics highlight that even with strong trailing growth, the current valuation looks demanding, and that concern is grounded in the gap between US$98.45 and both the 46x P/E multiple and the lower DCF fair value of US$70.59.
Bears can argue that paying more than peers and the wider industry on P/E requires the company to keep delivering the kind of 28.2% earnings growth reported over the last year.
At the same time, the difference between the current share price and the DCF fair value figure shows how sensitive any valuation case can be to the cash flow assumptions baked into that model.
Quarterly EPS range and 32.6% margin test earnings durability
Across the last six quarters, basic EPS moved between US$0.45 and US$0.59 per quarter while trailing twelve month EPS reached US$2.14, alongside the 32.6% net margin reported over the same period.
Supporters of the bullish view argue that this spread of quarterly EPS around roughly the US$0.50 mark, combined with a net margin that stayed close to 32% in both the latest and prior year, points to an earnings base that has held up across different quarters, even as individual three month periods showed some variation.
The trailing twelve month revenue figures, from US$517.7 million up to US$707.6 million in the reported series, provide context for those EPS numbers by showing that Rambus has been reporting higher revenue levels over time in the same window.
Net income across those trailing periods, moving from US$176.2 million to US$230.5 million, gives bulls a concrete earnings series to compare with the current share price of US$98.45 and the 46x P/E that comes with it.
Next Steps
Don't just look at this quarter; the real story is in the long-term trend. We've done an in-depth analysis on Rambus's growth and its valuation to see if today's price is a bargain. Add the company to your watchlist or portfolio now so you don't miss the next big move.
See What Else Is Out There
For all the high margins and EPS figures, critics point out that a 46x P/E and share price above the cited DCF fair value leave little room for error.
If paying up for that kind of premium worries you, use our these 871 undervalued stocks based on cash flows to zero in on ideas where pricing looks tighter and the valuation gap appears more in your favor.
This article by Simply Wall St is general in nature. We provide commentary based on historical data and analyst forecasts only using an unbiased methodology and our articles are not intended to be financial advice. It does not constitute a recommendation to buy or sell any stock, and does not take account of your objectives, or your financial situation. We aim to bring you long-term focused analysis driven by fundamental data. Note that our analysis may not factor in the latest price-sensitive company announcements or qualitative material. Simply Wall St has no position in any stocks mentioned.