
Please use a PC Browser to access Register-Tadawul
Get It
Reassessing Skyward Specialty Insurance Group (SKWD) After Recent Pullback In Specialty Insurance Stocks
Skyward Specialty Insurance Group, Inc. SKWD | 46.88 | +2.27% |
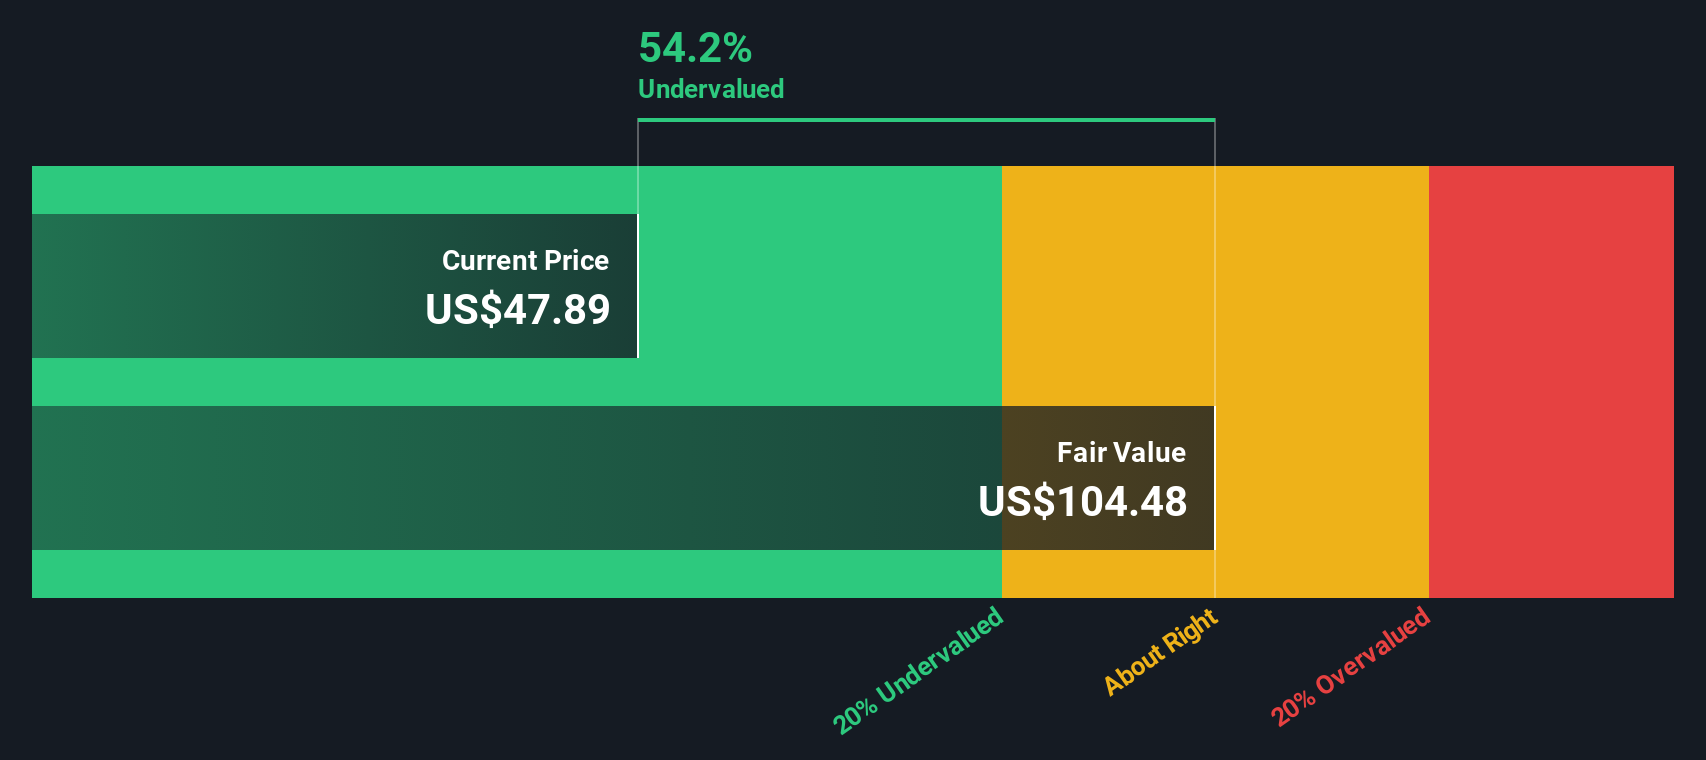
The Excess Returns model looks at how much profit a company is expected to earn over and above the return that shareholders require, and then converts those extra profits into an estimate of fair value per share.
For Skyward Specialty Insurance Group, the starting point is its book value of $23.75 per share and an average return on equity of 18.83%. Analysts expect stable earnings of about $5.70 per share, based on weighted future Return on Equity estimates from 5 analysts. The model applies a cost of equity of $2.10 per share, which implies an excess return of $3.59 per share, or the amount the company is expected to earn beyond investors’ required return.
The stable book value is estimated at $30.26 per share, sourced from weighted future Book Value estimates from 7 analysts. Using these inputs within the Excess Returns framework results in an intrinsic value estimate of about $127.45 per share. This is 65.3% above the recent share price of US$44.25 and suggests the shares screen as materially undervalued on this measure.
Result: UNDERVALUED
Our Excess Returns analysis suggests Skyward Specialty Insurance Group is undervalued by 65.3%. Track this in your watchlist or portfolio, or discover 867 more undervalued stocks based on cash flows.
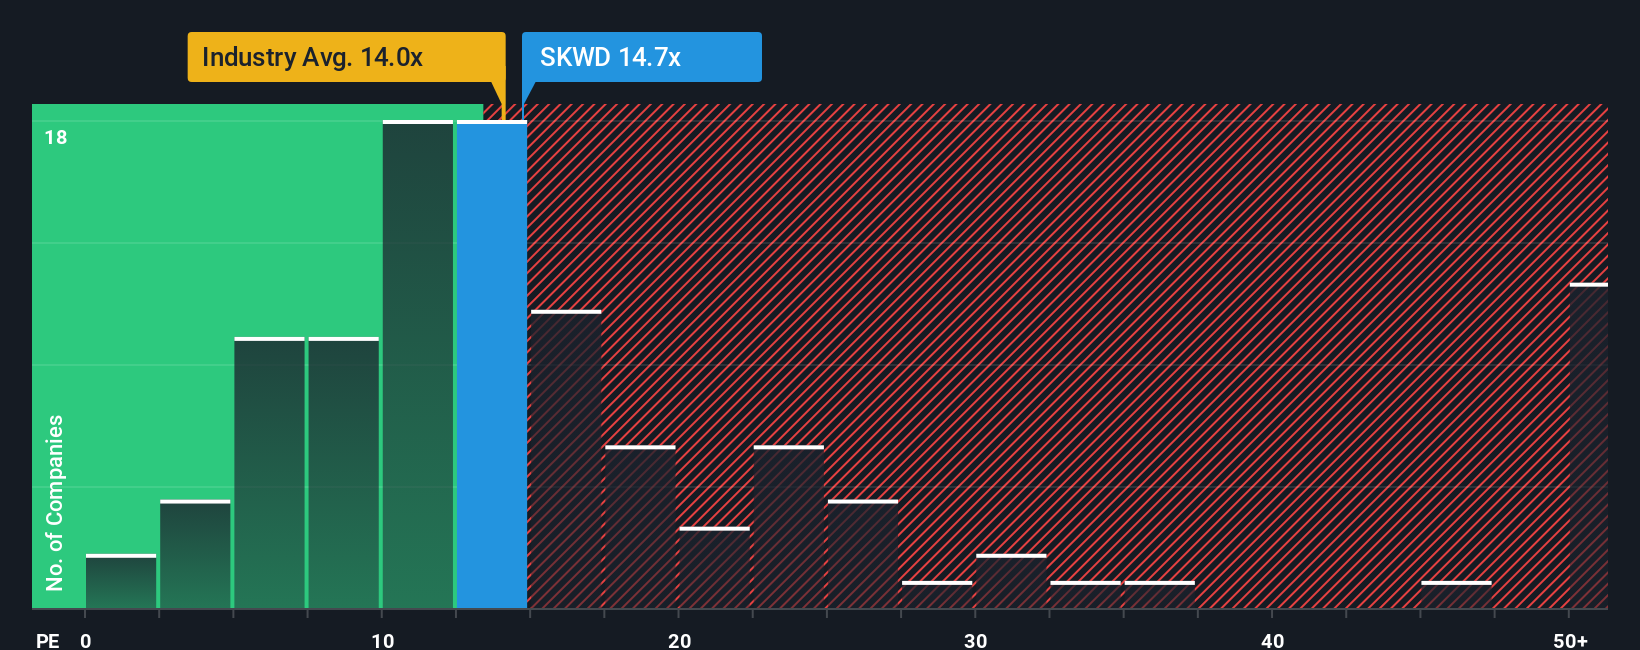
For a profitable insurer like Skyward Specialty Insurance Group, the P/E ratio is a useful way to relate what you pay per share to the earnings the company generates. Investors usually accept a higher P/E when they expect stronger growth or see the earnings as relatively predictable, and a lower P/E when future growth looks modest or the risk profile feels higher.
Right now, Skyward Specialty Insurance Group trades on a P/E of 13.84x. That sits slightly above the Insurance industry average of 13.29x, but well below the broader peer group average of 27.70x. Simply Wall St also calculates a proprietary “Fair Ratio” of 16.93x for the company. This is the P/E level it views as reasonable given factors such as earnings growth estimates, profit margins, the company’s size, its industry and identified risks.
This Fair Ratio is more tailored than a simple comparison with peers or an industry average because it attempts to adjust for Skyward Specialty Insurance Group’s own characteristics rather than treating all insurers as the same. With the current P/E of 13.84x sitting below the Fair Ratio of 16.93x, the shares screen as cheaper than this customised benchmark.
Result: UNDERVALUED
P/E ratios tell one story, but what if the real opportunity lies elsewhere? Discover 1422 companies where insiders are betting big on explosive growth.
Earlier we mentioned that there is an even better way to understand valuation. Let us introduce you to Narratives, where you combine your view of Skyward Specialty Insurance Group’s story with your own assumptions for fair value, future revenue, earnings and margins. You then link that story to a financial forecast and a fair value that you can compare with the current share price on Simply Wall St’s Community page. Millions of investors use this page, and it updates your Narrative automatically when new information like earnings or news arrives. This means two investors can look at the same company and one might build a Narrative that supports a much higher fair value, while another might build one that supports a much lower fair value. Each can then decide for themselves whether the current price looks attractive, expensive, or somewhere in between.
Do you think there's more to the story for Skyward Specialty Insurance Group? Head over to our Community to see what others are saying!

This article by Simply Wall St is general in nature. We provide commentary based on historical data and analyst forecasts only using an unbiased methodology and our articles are not intended to be financial advice. It does not constitute a recommendation to buy or sell any stock, and does not take account of your objectives, or your financial situation. We aim to bring you long-term focused analysis driven by fundamental data. Note that our analysis may not factor in the latest price-sensitive company announcements or qualitative material. Simply Wall St has no position in any stocks mentioned.
