Resources Connection (RGP) Q2 Loss Deepens Bearish Narrative On Turnaround Prospects

Resources Connection, Inc. -2.62%

Resources Connection, Inc.

RGP

3.72

-2.62%

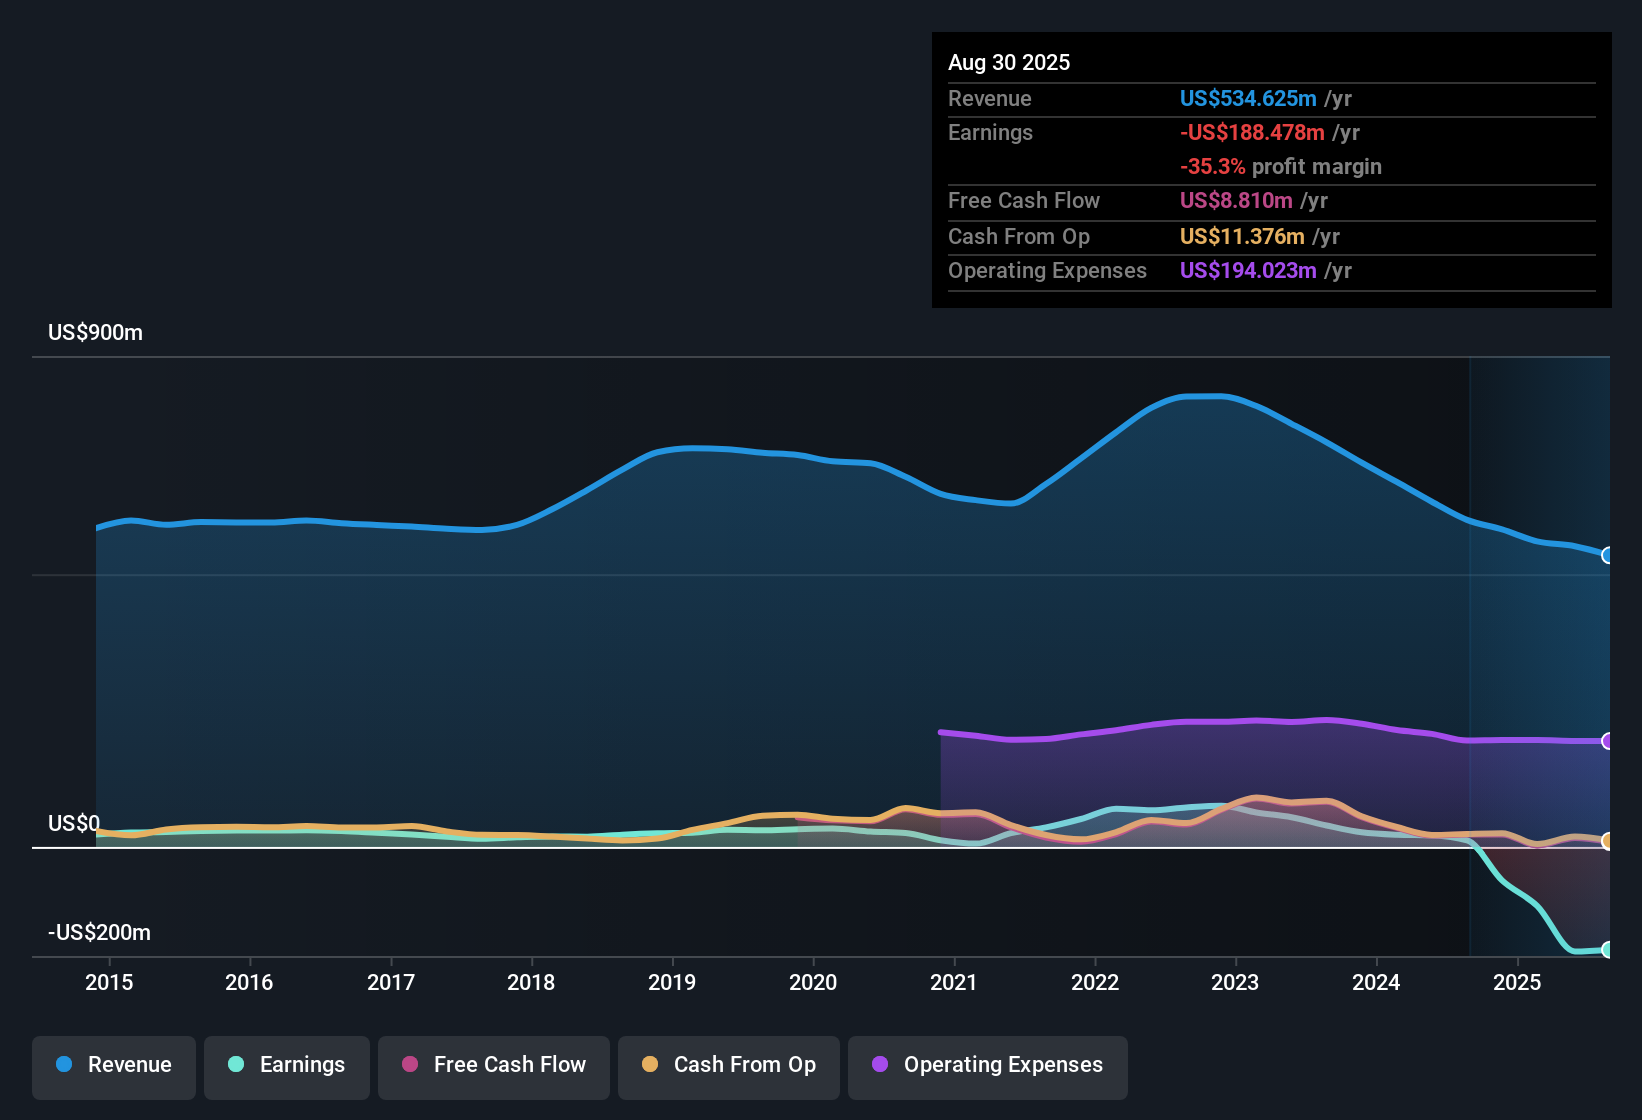
Resources Connection (RGP) has just posted Q2 2026 results with revenue of US$117.7 million and a basic EPS loss of US$0.38, alongside a net loss of US$12.7 million. Over the past six quarters, revenue has moved from US$145.6 million in Q2 2025 to US$117.7 million in Q2 2026. Quarterly EPS has ranged from a loss of US$2.23 in Q4 2025 to a loss of US$0.07 in Q1 2026, and trailing twelve month EPS now sits at a loss of US$4.01 on revenue of US$506.7 million. With losses still weighing on margins, the key question for investors is how this earnings print fits with expectations for a longer term profitability turnaround.

See our full analysis for Resources Connection.

With the headline numbers on the table, the next step is to see how this latest set of margins and growth signals lines up with the prevailing bull and bear narratives around Resources Connection.

NasdaqGS:RGP Earnings & Revenue History as at Jan 2026

Losses Still Heavy On A Smaller Revenue Base

  • Over the last twelve months, Resources Connection generated US$506.7 million of revenue but recorded a net loss of US$132.4 million, with trailing EPS at a loss of US$4.01.
  • Bears point to this mix of shrinking revenue and steep losses as a sign that the business model is under pressure.
    • Revenue on a trailing basis has moved from US$599.6 million in early 2025 to US$506.7 million in Q2 2026, while net loss widened from US$61.4 million to US$132.4 million over that span.
    • Critics also highlight that losses have grown at about 60.3% per year over the past five years, which lines up with the current unprofitable status shown in the latest Q2 2026 loss of US$12.7 million.
Keep in mind how quickly losses have built up when you weigh the more cautious arguments around RGP’s core business. 🐻 Resources Connection Bear Case

Valuation Signals A Large Gap To DCF Fair Value

  • The company is trading on a P/S of 0.3x versus a peer average of 7.3x and an industry average of 1.3x. The stated DCF fair value of US$40.65492382899002 is far above the current share price of US$4.50.
  • Bulls argue that this wide gap between market price and valuation metrics points to meaningful upside potential if profitability improves.
    • Supporters often cite that the stock price is a small fraction of the DCF fair value and also below peers on simple sales multiples. Both of these are based on the current revenue base of around US$506.7 million over the last twelve months.
    • At the same time, the company remains loss making on US$132.4 million of trailing net losses, so the pricing gap heavily supports the bullish case only if the forecast shift to positive earnings materializes.
If you are weighing that bullish view, it is worth comparing these valuation gaps with how the business performance evolves over the next few reports. 🐂 Resources Connection Bull Case

Dividend Yield High But Not Covered By Cash Flows

  • The shares currently offer a 6.22% dividend yield, yet that payout is not covered by either earnings or free cash flow given the trailing net loss of US$132.4 million.
  • Bears focus on this dividend profile as a financial risk, because it relies on cash sources other than current earnings.
    • The company has reported net losses in each of the last six quarters, ranging from a loss of US$2.4 million to US$73.3 million, which means there has been no earnings support for dividends across that stretch.
    • With trailing EPS at a loss of US$4.01 and no free cash flow coverage cited, critics argue that maintaining a 6.22% yield could pressure the balance sheet if operating performance does not improve.

Next Steps

To see how these results tie into long-term growth, risks, and valuation, check out the full range of community narratives for Resources Connection on Simply Wall St. Add the company to your watchlist or portfolio so you'll be alerted when the story evolves.

See the numbers differently? If this data points you in another direction, shape that view into your own narrative in just a few minutes: Do it your way.

A great starting point for your Resources Connection research is our analysis highlighting 3 key rewards and 1 important warning sign that could impact your investment decision.

See What Else Is Out There

Resources Connection is working through shrinking revenue, heavy trailing losses of US$132.4 million, and a dividend that is not covered by earnings or free cash flow.

If you want income ideas with payouts that look better supported by underlying business performance, check out these 1855 dividend stocks with yields > 3% today to compare alternatives with stronger dividend coverage profiles.

This article by Simply Wall St is general in nature. We provide commentary based on historical data and analyst forecasts only using an unbiased methodology and our articles are not intended to be financial advice. It does not constitute a recommendation to buy or sell any stock, and does not take account of your objectives, or your financial situation. We aim to bring you long-term focused analysis driven by fundamental data. Note that our analysis may not factor in the latest price-sensitive company announcements or qualitative material. Simply Wall St has no position in any stocks mentioned.

Every question you ask will be answered
Scan the QR code to contact us
whatsapp
Also you can contact us via