
Please use a PC Browser to access Register-Tadawul
Get It
Rivian (RIVN): Rebuilding Momentum and What Its Recent Share Price Gains Mean for Valuation
Rivian Automotive, Inc. Class A RIVN | 15.27 | -2.05% |
Rivian Automotive (RIVN) has quietly ground higher, with shares up about 44% over the past 3 months, even as the stock slipped recently and set up a fresh debate on valuation and execution.
Even after the recent pullback, Rivian’s 43.78% 3 month share price return and 17.71% 1 year total shareholder return suggest momentum is rebuilding as investors reassess both growth prospects and execution risk at a share price of $19.41.
If Rivian’s move has you watching the EV space more closely, it is a good moment to scan other auto names with our auto manufacturers and see what else stands out.
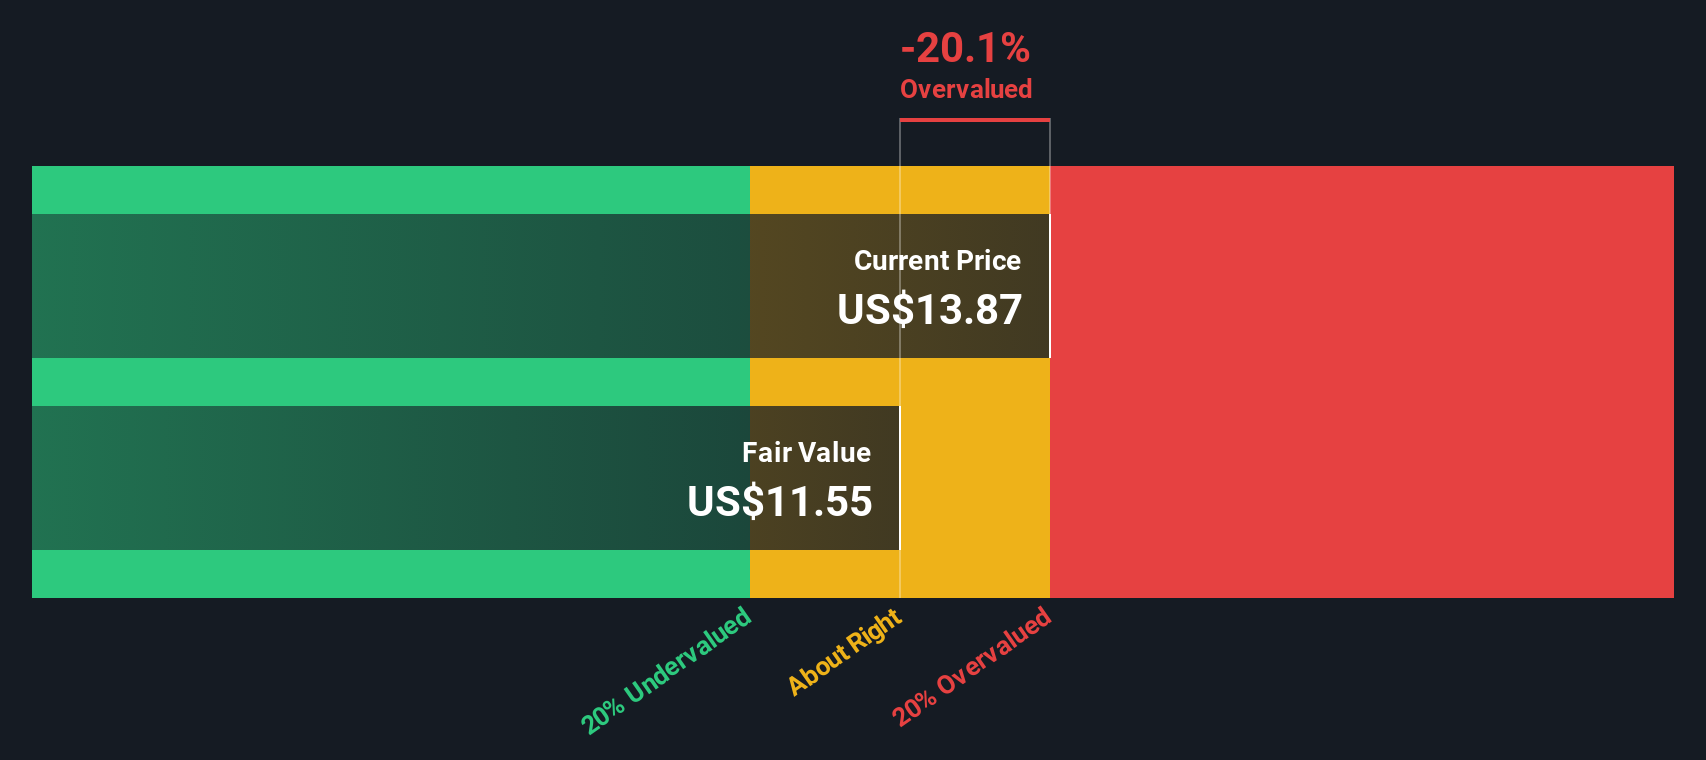
With Rivian still unprofitable, analysts’ average target below the current price and intrinsic estimates implying upside, the key question now is whether investors are getting in early or if the market already reflects the next leg of growth.
Compared with the latest close at $19.41, the most widely followed narrative pegs Rivian’s fair value quite a bit lower and builds that view from detailed long term cash flow and earnings assumptions.
The analysts have a consensus price target of $13.85 for Rivian Automotive based on their expectations of its future earnings growth, profit margins and other risk factors. However, there is a degree of disagreement amongst analysts, with the most bullish reporting a price target of $21.0, and the most bearish reporting a price target of just $7.55.
Curious why this narrative still leans cautious despite aggressive revenue ramps and margin improvement baked in, plus a premium future earnings multiple that rivals faster growing sectors? The full breakdown reveals which assumptions are doing the heavy lifting and how a single shift in growth, profitability, or the discount rate could swing the outcome.
Result: Fair Value of $15.75 (OVERVALUED)
However, that path is vulnerable to expiring EV incentives and ongoing cash burn, which could delay profitability targets and force more dilutive capital raises.
While the most popular narrative sees Rivian as 23.2 percent overvalued at $19.41 versus a $15.75 fair value, our DCF model paints a very different picture. It suggests fair value closer to $40.55, or roughly 52 percent above today’s price. Which story do you trust more: cautious earnings multiples or long term cash flows?
Simply Wall St performs a discounted cash flow (DCF) on every stock in the world every day (check out Rivian Automotive for example). We show the entire calculation in full. You can track the result in your watchlist or portfolio and be alerted when this changes, or use our stock screener to discover 875 undervalued stocks based on their cash flows. If you save a screener we even alert you when new companies match - so you never miss a potential opportunity.
If you are not fully convinced by this view or prefer digging into the numbers yourself, you can build a tailored thesis in minutes, Do it your way.
A great starting point for your Rivian Automotive research is our analysis highlighting 2 key rewards and 3 important warning signs that could impact your investment decision.
Do not stop at one idea. Use the Simply Wall St Screener today to uncover fresh opportunities other investors may only notice after significant market moves.
This article by Simply Wall St is general in nature. We provide commentary based on historical data and analyst forecasts only using an unbiased methodology and our articles are not intended to be financial advice. It does not constitute a recommendation to buy or sell any stock, and does not take account of your objectives, or your financial situation. We aim to bring you long-term focused analysis driven by fundamental data. Note that our analysis may not factor in the latest price-sensitive company announcements or qualitative material. Simply Wall St has no position in any stocks mentioned.
