
Please use a PC Browser to access Register-Tadawul
Get It
Royal Gold (RGLD) Valuation Check After Tenth Straight Dividend Raise And Record Gold Prices
Royal Gold, Inc. RGLD | 285.54 | +5.06% |
Royal Gold (RGLD) has attracted investors’ attention after announcing a 6% dividend increase for 2026, its 10th straight annual raise, at a time when gold prices sit at record highs.
The dividend news arrives during a strong run in the stock, with a 30 day share price return of 20.66% and a 90 day share price return of 52.41%. The 1 year total shareholder return of 103.52% signals powerful momentum for investors who have stayed the course.
If Royal Gold’s move has you rethinking your income ideas in mining, it could be a useful moment to widen the lens and look at pharma stocks with solid dividends as another source of dividend opportunities.
With Royal Gold trading around $279.54, slightly above the average analyst price target and with insider selling in the mix, investors may need to consider whether there is still value on the table or whether the market is already pricing in future growth.
Royal Gold closed at US$279.54, and the current P/E of 49.1x places the stock at a rich earnings multiple compared with several benchmarks.
The P/E ratio tells you how much investors are paying today for each dollar of current earnings, which is especially watched in cash generative, asset light models like royalty and streaming businesses. With earnings having grown strongly in the recent period and forecasts pointing to further profit growth, a higher multiple can reflect the market paying up for that earnings profile.
Here, the 49.1x P/E stands well above the estimated fair P/E of 26.3x, a level our fair ratio work suggests the market could potentially gravitate toward over time. It also sits above the US Metals and Mining industry average of 28x and above the peer group average of 27.6x, which indicates investors are accepting a premium price tag versus both the broader sector and closer comparables.
Result: Price-to-Earnings of 49.1x (OVERVALUED)
However, the rich 49.1x P/E, recent 1 year total return of 103.52%, and insider selling leave less room for disappointment if sentiment around gold or royalties cools.
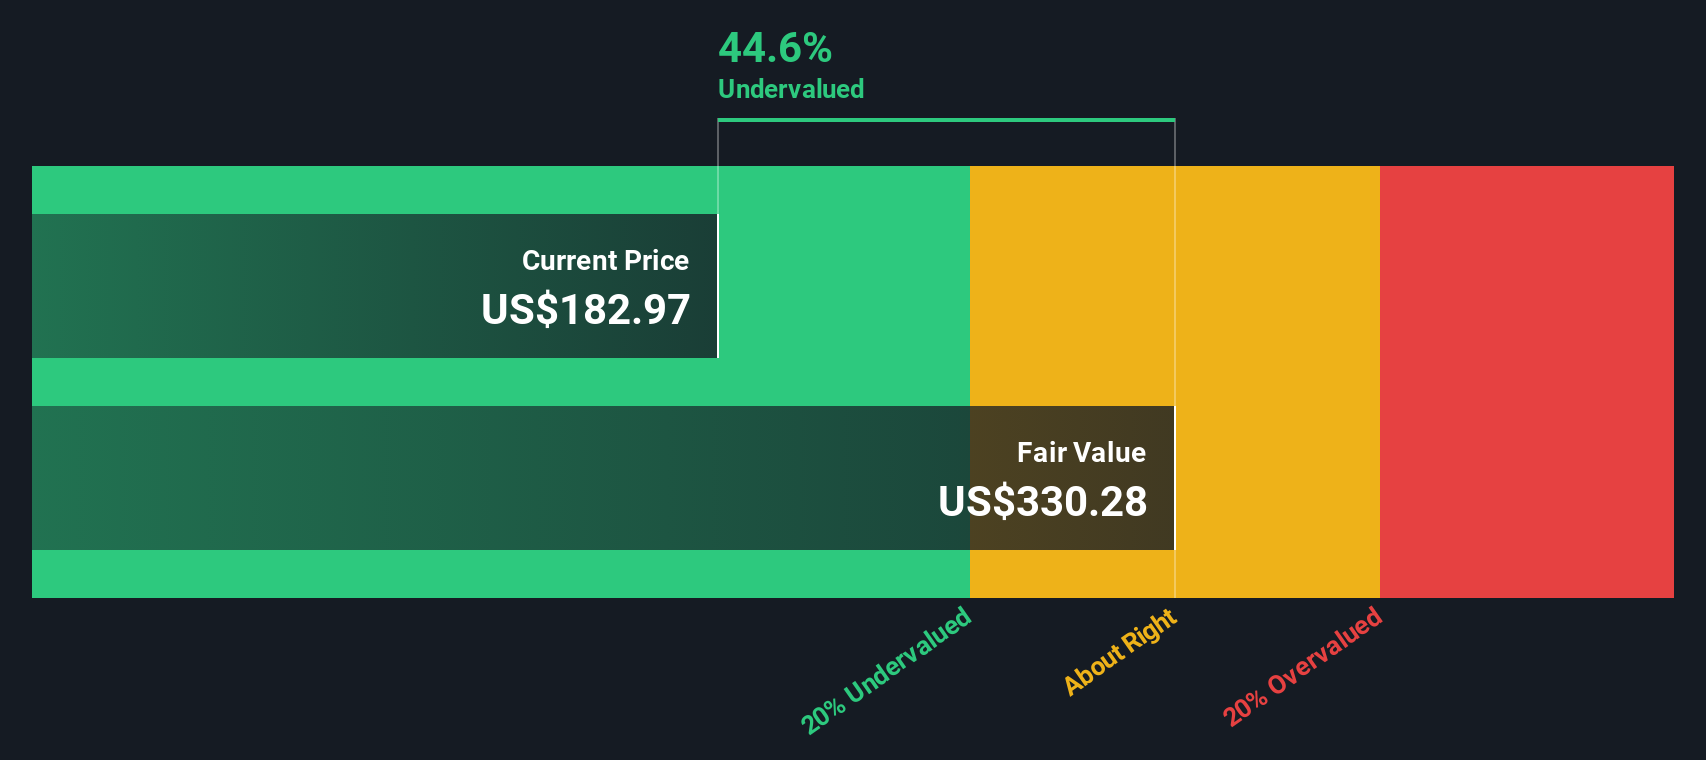
Our DCF model points in the same direction as the rich 49.1x P/E. With Royal Gold at US$279.54 versus an estimated future cash flow value of US$268.88, the shares also look expensive on cash flows, which limits the margin of safety if expectations slip even slightly.
Simply Wall St performs a discounted cash flow (DCF) on every stock in the world every day (check out Royal Gold for example). We show the entire calculation in full. You can track the result in your watchlist or portfolio and be alerted when this changes, or use our stock screener to discover 883 undervalued stocks based on their cash flows. If you save a screener we even alert you when new companies match - so you never miss a potential opportunity.
If you see the numbers differently or prefer to test your own assumptions, you can build a fresh story around Royal Gold in just a few minutes, starting with Do it your way.
A great starting point for your Royal Gold research is our analysis highlighting 2 key rewards and 2 important warning signs that could impact your investment decision.
If Royal Gold has sharpened your focus, do not stop here. Use the Simply Wall St Screener to round out your watchlist with more targeted opportunities.
This article by Simply Wall St is general in nature. We provide commentary based on historical data and analyst forecasts only using an unbiased methodology and our articles are not intended to be financial advice. It does not constitute a recommendation to buy or sell any stock, and does not take account of your objectives, or your financial situation. We aim to bring you long-term focused analysis driven by fundamental data. Note that our analysis may not factor in the latest price-sensitive company announcements or qualitative material. Simply Wall St has no position in any stocks mentioned.
