Ryan Specialty Holdings Q4 Margin Improvement Reinforces Bullish Profitability Narrative
Ryan Specialty Holdings, Inc. Class A RYAN | 34.16 34.16 | +1.94% 0.00% Pre |
Ryan Specialty Holdings (RYAN) has wrapped up FY 2025 with fourth quarter revenue of US$751.2 million and basic EPS of US$0.06, while trailing twelve month EPS sits at US$0.50 on revenue of about US$3.1 billion, alongside trailing earnings growth of 126.2% and a net margin of 7.0% compared with 3.9% a year earlier. The company has seen quarterly revenue move from US$649.4 million and EPS of US$0.04 in Q4 2024 to US$751.2 million and EPS of US$0.06 in Q4 2025, against a backdrop of five year annualized earnings growth of 27.2% and analyst expectations for about 27.5% annual earnings growth ahead. Taken together, these results point to profitability that has become more efficient on each dollar of revenue, setting up a margin focused read of the latest numbers.
See our full analysis for Ryan Specialty Holdings.With the headline figures on the table, the next step is to see how this earnings profile lines up with the widely followed narratives around Ryan Specialty Holdings and where the numbers challenge those stories.
TTM earnings growth outpaces revenue
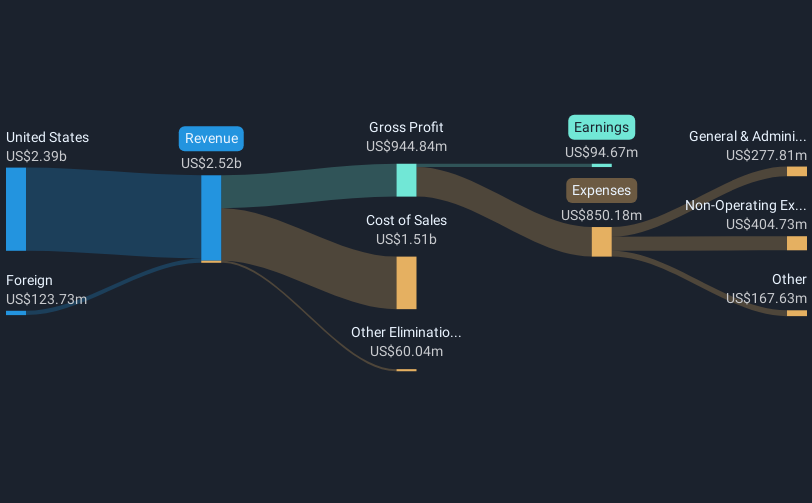
- Over the last twelve months, net income reached US$214.2 million on US$3.1b of revenue, compared with US$94.7 million on US$2.5b a year earlier, which lines up with the 126.2% trailing earnings growth figure and a net margin of 7.0% versus 3.9% last year.
- Consensus narrative says long term growth will be driven by specialty market expansion and technology investment, and this recent jump in earnings gives some support to that view, yet it also raises questions:
- On one hand, analysts are looking for about 11.9% annual revenue growth and about 27.5% annual earnings growth. This is broadly in line with the recent gap between revenue growth and much faster profit growth.
- On the other hand, part of the TTM picture includes a weak Q1 2025, when the company reported a loss of US$27.6 million despite US$676.1 million of revenue. Investors may therefore want to think about how repeatable the latest 7.0% net margin really is.
Quarterly swings contrast with 27.2% 5 year trend
- Within FY 2025, basic EPS moved from a loss of US$0.22 in Q1 to US$0.41 in Q2 and then to US$0.24 in Q3 and US$0.06 in Q4, even as quarterly revenue stayed in a relatively tight range between US$676.1 million and US$840.9 million, alongside five year annualized earnings growth of 27.2%.
- Bulls argue that integration of acquisitions and tech investment can support sustained earnings gains, yet the pattern inside the year highlights a few tensions with that bullish pitch:
- Supportive for the bullish view, the business has grown to about US$3.1b of TTM revenue and TTM EPS of US$0.50, which is consistent with the idea of scale building over several years rather than stalling.
- Challenging the bullish storyline, the move from a loss in Q1 to much stronger Q2 EPS and then softer Q3 and Q4 EPS suggests earnings are still bumpy. The straight line paths to much higher margins in bullish models therefore depend on smoothing out swings that are still very visible in the actual quarterly results.
Valuation gap vs DCF and interest coverage risk
- The shares trade at US$38.71 with a P/E of 23.4x compared with peers at 28.9x and the US Insurance industry at 12.3x. A DCF fair value of US$124.98 points to a large gap between that model and the current price, even as interest payments are flagged as not well covered by earnings.
- Bears focus on financial and competitive pressures, and the current numbers give them a few concrete hooks alongside some offsets:
- Critics highlight that interest costs are not well covered by current earnings, and the relatively high P/E versus the broader insurance industry at 12.3x leaves less room if higher debt or rates hold back the 27.5% expected earnings growth.
- What pushes against the bearish view is that the company is priced below the peer average P/E of 28.9x and the TTM margin has moved to 7.0%, which is higher than 3.9% last year. The market is therefore already applying some discount despite recent profitability gains.
Next Steps
To see how these results tie into long-term growth, risks, and valuation, check out the full range of community narratives for Ryan Specialty Holdings on Simply Wall St. Add the company to your watchlist or portfolio so you'll be alerted when the story evolves.
See the numbers differently? If this story plays out another way in your view, you can shape it into your own narrative in just a few minutes, Do it your way.
A great starting point for your Ryan Specialty Holdings research is our analysis highlighting 3 key rewards and 1 important warning sign that could impact your investment decision.
Explore Alternatives
Ryan Specialty Holdings shows strong trailing figures, but its uneven quarterly EPS, weak Q1 loss, and flagged interest coverage leave some investors cautious about consistency.
If those swings and debt concerns make you want a steadier profile, check out our 85 resilient stocks with low risk scores built to surface companies with more resilient earnings and risk scores right now.
This article by Simply Wall St is general in nature. We provide commentary based on historical data and analyst forecasts only using an unbiased methodology and our articles are not intended to be financial advice. It does not constitute a recommendation to buy or sell any stock, and does not take account of your objectives, or your financial situation. We aim to bring you long-term focused analysis driven by fundamental data. Note that our analysis may not factor in the latest price-sensitive company announcements or qualitative material. Simply Wall St has no position in any stocks mentioned.