Seeking 10-Baggers | What Technical Indicators Show Bullish Signs, and How to Analyze Them?
ALRAJHI 1120.SA | 106.40 | -0.09% |
SAUDI RE 8200.SA | 25.50 | +4.04% |
S&P 500 index SPX | 6582.69 | +0.11% |
Dow Jones Industrial Average DJI | 46504.67 | -0.13% |
NASDAQ IXIC | 21879.18 | +0.18% |
Strong Technicals and Solid Fundamentals Are The Foundation of 10-Baggers
In the previous article, we briefly introduced fundamental analysis. According to the theory of trend investment, we also need to combine technical analysis to find those potential high-performing stocks.
Trend investment emphasizes "going with the trend", that is, we buy when the stock price is rising, hold the stocks, and finally sell when the stock price reaches its peak or starts to decline (as shown in Figure 1).
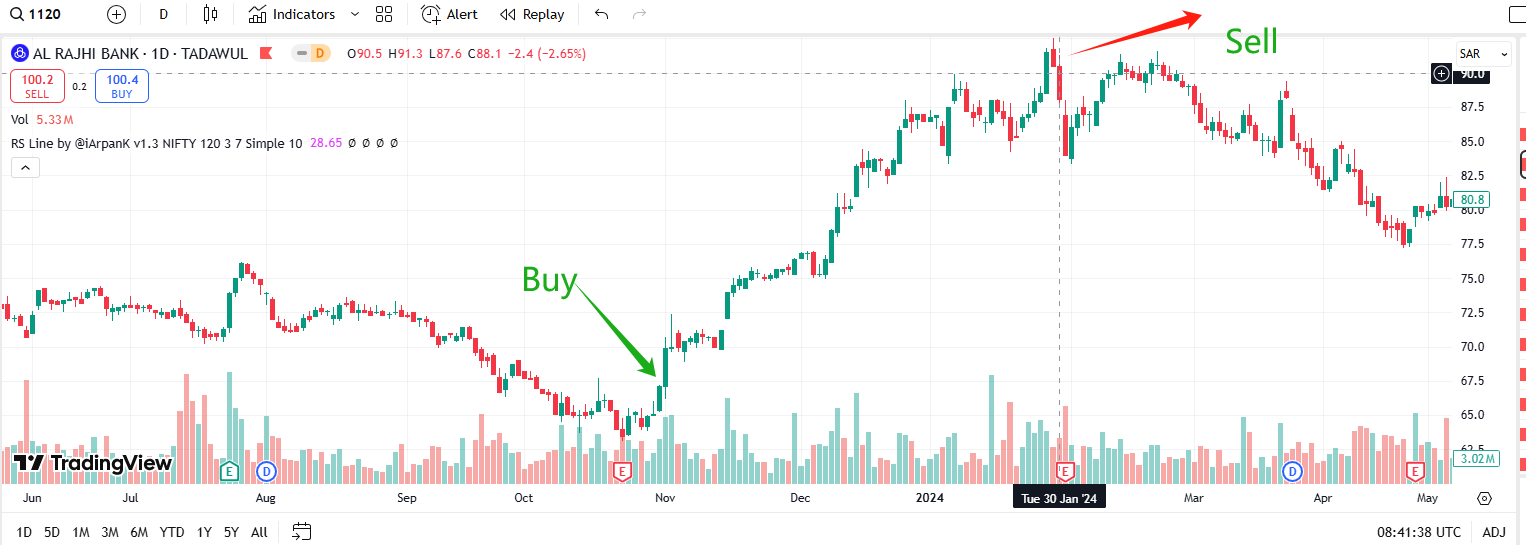
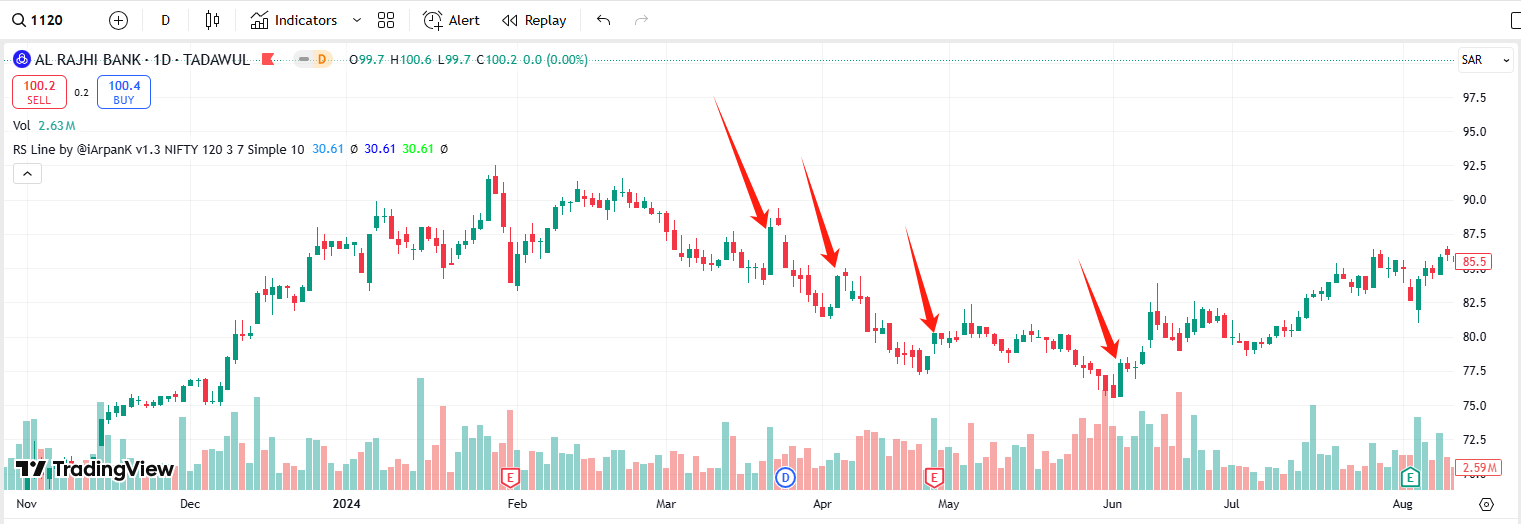
Of course, this is the most ideal situation. In fact, it is very difficult for us to accurately "bottom-fish" and "escape the peak". Because it is difficult for us to identify whether a certain upward movement is just a short-term rebound or a reversal of the long-term trend.
If we blindly try to bottom-fish, the following situation may occur (as shown in Figure 2). After we buy, the stock price continues to decline, resulting in losses. As we can see from the figure, after experiencing several rebounds during the decline, the last upward movement finally confirmed the reversal of the long-term trend.
Therefore, we should change our thinking. Instead of expecting to accurately bottom-fish and escape the peak, we only need to take a part of the profit during the upward movement. According to this thinking, the technical pattern we want emerges.
1. Look for the breakout point after the reversal of the medium-term trend
"Look for the entry point where the long-term trend has been reversed, and after a period of adjustment, the stock price breaks through with increased trading volume again."
As shown in the figure, we still take the stock Al Rajhi Bank(1120.SA) as an example. During the decline of this stock, it experienced several rebounds. Finally, during the upward movement in early June 2024, the stock price reached the bottom and started to rebound, and the medium-term moving average also started to turn upward (the 50-day moving average in the figure is also the most commonly used medium-term moving average by me).
As mentioned earlier, we don't expect to catch this "rebound from the bottom". In the subsequent trend, we need to continue to observe the rebound situation. The difference this time is that when the stock price rebounds and then corrects again, the low point of the stock price starts to move up, thus forming a horizontal base (as shown in the box in the figure). Then, we start to look for our entry point.
As shown by the arrows in the figure 3, each breakout with increased trading volume is an entry opportunity that can be tried. According to this method, although we didn't buy at the very bottom, the success rate after our purchase has been greatly improved. Once the upward trend is confirmed, the capital utilization efficiency also reaches the best.
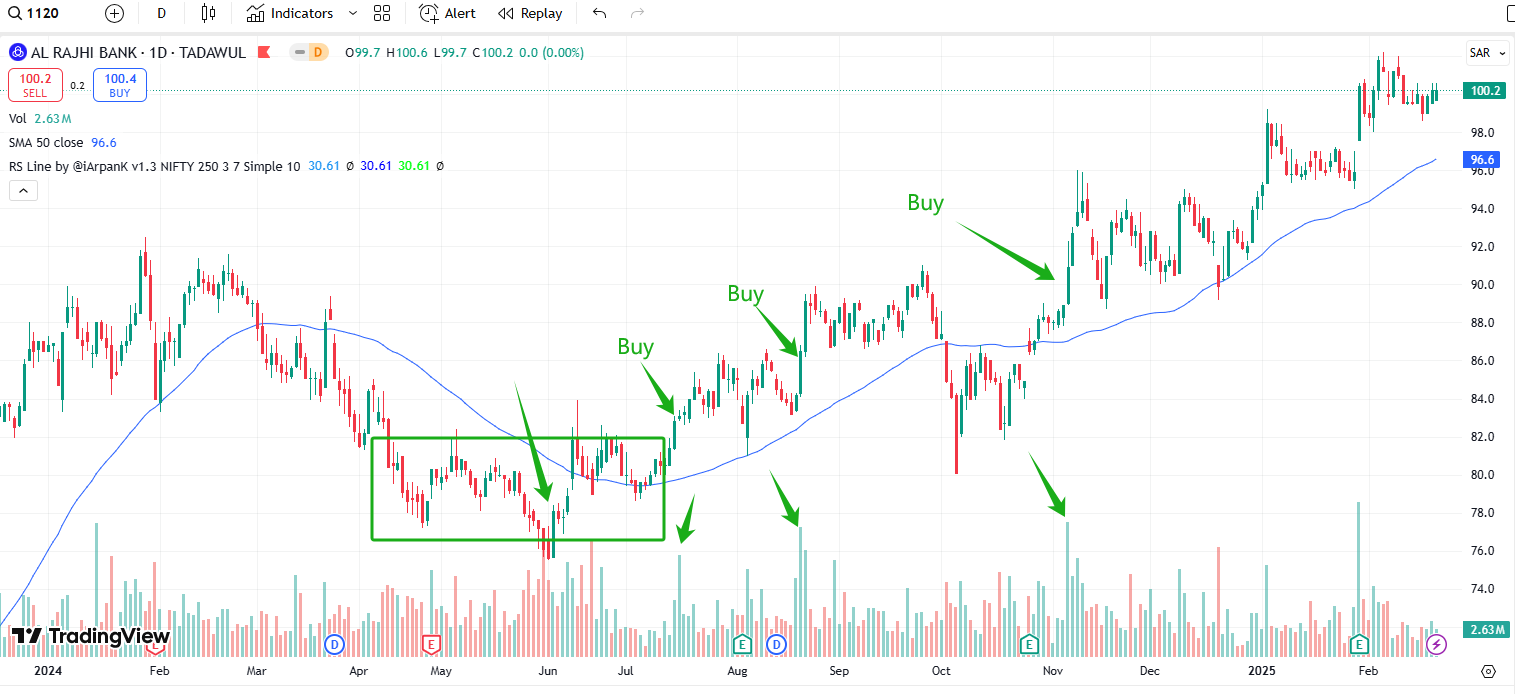
Of course, this doesn't mean that all similar technical patterns will rise after being bought. Here we are just explaining the "necessary path" for the birth of a high-performing stock. Ideally, the stock price will rise immediately after being bought, and then we can find an opportunity to sell for profit. If it doesn't meet our expectations, we should decisively adopt a stop-loss strategy, or use the position to protect, etc. These contents will be explained in detail in subsequent articles.
2. A very classic technical indicator - relative stock price strength
Investment is a process of making decisions after processing comprehensive information. We can't just rely on the trend reversal in technical analysis to decide to buy a position. Many times, we need to cross-verify several indicators and then decide to buy based on fundamental analysis. Therefore, here I would like to introduce a technical indicator that I like very much - relative stock price strength(RPS).
The relative stock price strength means the strength of the price change of a stock compared with that of other stocks in the market during the same period. For example, within 50 trading days, Stock A has increased by 20% and Stock B has increased by 10%, which means that the 50-day relative strength of Stock A is higher than that of Stock B. Similarly, within 50 trading days, if Stock A has decreased by 10% and Stock B has decreased by 20%, the 50-day relative strength of Stock A is still higher than that of Stock B. In a nutshell, within the same period, the stock that rises the most or falls the least has a higher strength.
Regarding how to calculate the stock strength and more detailed information, this article will not elaborate further. You can refer to this article >>
The value range of RPS is from 0 to 100. If the RPS of a stock reaches 100, it means that during this period, the increase of this stock has exceeded that of all other stocks in the market. Usually, I will focus on stocks with an RPS exceeding 80.
The meaning of this indicator and its combination with the previous technical analysis lies in that I only focus on stocks with an RPS exceeding 80, that is, the top 20% strongest stocks in the market. There is a high probability that this stock is already in an upward trend, and I only need to operate in combination with other indicators.
The theoretical basis behind this indicator is that if a stock is stronger than other stocks in the market for a considerable period of time, there must be some supporting factors behind it. These factors may be the increase in performance, the improvement of the business, or mergers and acquisitions, etc. We need to further explore these factors.
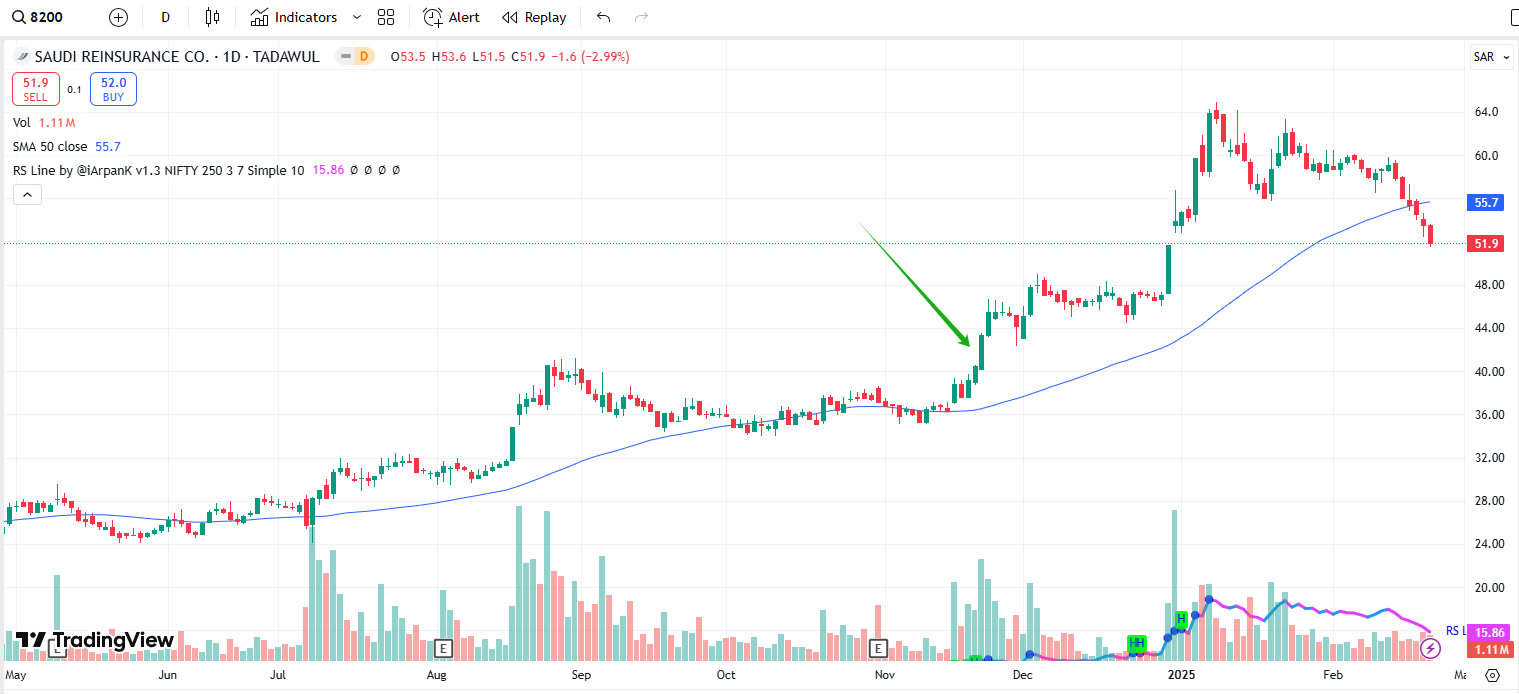
In our weekly regularly updated column "Long-Term Strong Saudi Stocks", we mainly use the parameter of RPS. For example, in the first issue of this column we released, that is, on November 22, 2024, we paid attention to the stock Saudi Reinsurance Co.(8200.SA) . Up to now, this stock is still a frequent visitor on our long-term strong stock list.
Through the RPS indicator, we can quickly locate those strong stocks from a large number of stocks and improve our research efficiency. Regarding how to apply this indicator specifically, we will gradually interpret it in subsequent articles.
Note: We are thrilled that you've made it to the end of this article. Our "10-baggers" series is scheduled to run for eight installments, with a new edition coming out every week. The primary purpose of this series is to share experiences and facilitate discussions among investors.
Upcoming Preview: How to Select stocks? Which Stocks Do I Pay Attention to Every Day?
Disclaimer: The articles in this series are original works by the sahm team, primarily intended to share investment experiences for the exchange among investors. If individual stocks are mentioned within the articles, they serve solely as examples for discussion and should not be considered as investment recommendations.