
Please use a PC Browser to access Register-Tadawul
Get It
Should Investors Rethink Dutch Bros After Shares Surge Nearly 90% Over the Past Year?
Dutch Bros Inc. BROS | 62.00 | +2.33% |
If you have been keeping an eye on Dutch Bros, you are certainly not alone. Whether you are a longtime shareholder or someone just weighing up your options, it is tough to ignore how this coffee chain’s stock has been percolating lately. Over the past year, Dutch Bros shares have climbed an incredible 89.8%, and even year-to-date the stock is up a solid 14.6%. The last thirty days have seen a 2.5% uptick, although the past week saw a minor dip of -2.2%. Those numbers suggest momentum, but they also raise the question of whether Dutch Bros is still worth buying at today’s price.
While growth stories like this can be exciting, they also raise concerns about whether enthusiastic investors have pushed the stock above its fair value. According to our valuation scorecard, Dutch Bros is currently undervalued in just 1 of the 6 main checks we use, giving it a value score of 1. In other words, by most traditional metrics, the company does not look especially cheap right now.
The key question, of course, is what these valuation methods actually tell us about the real worth of Dutch Bros, and whether there might be a better approach to understanding the true value behind the brand’s rapid expansion. Let us dive into the details of these valuation approaches, and consider a smarter framework to assess whether Dutch Bros deserves a spot in your portfolio.
Dutch Bros scores just 1/6 on our valuation checks. See what other red flags we found in the full valuation breakdown.The Discounted Cash Flow (DCF) model aims to estimate a company's value by projecting its future cash flows and then discounting those cash flows back to today's value. For Dutch Bros, this approach involves forecasting the business’s ability to generate cash and assessing how those numbers may grow in the years ahead.
Currently, Dutch Bros has a Free Cash Flow (FCF) of about -$5.3 million, meaning it is not generating positive cash flow at this stage. Over the next decade, however, analysts expect the company’s cash flows to improve substantially, with projections reaching $283.9 million by the end of 2029. It is important to note that analyst estimates are only available for the next five years. Projections beyond that are extrapolated to provide a fuller long-term picture.
Using these projections and the 2 Stage Free Cash Flow to Equity model, the DCF assigns Dutch Bros a fair value of $39.08 per share. When we compare this intrinsic value to the current market price, the model suggests the stock is 65.2% overvalued. That indicates investors are paying a significant premium today relative to the company’s long-term cash generation potential.
Result: OVERVALUED
Head to the Valuation section of our Company Report for more details on how we arrive at this Fair Value for Dutch Bros.
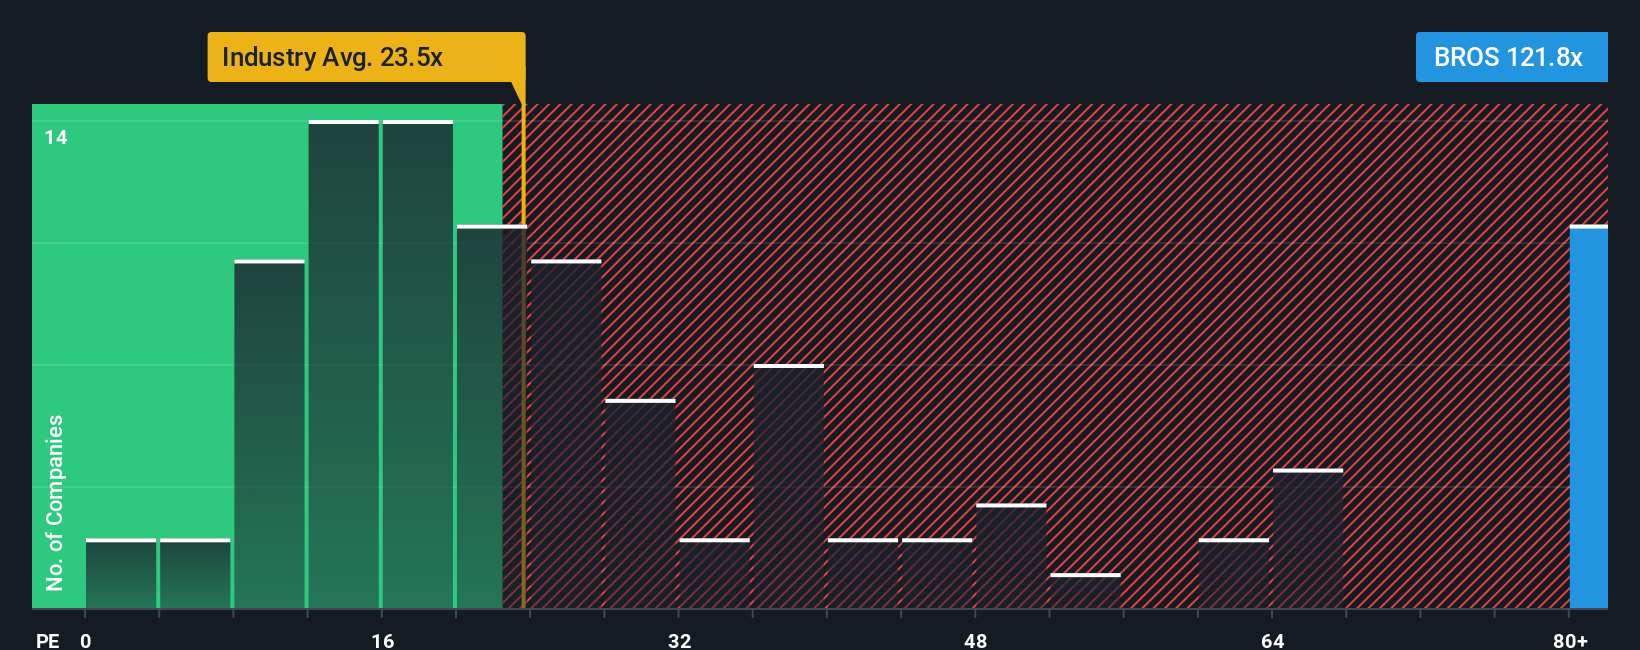
For profitable companies like Dutch Bros, the price-to-earnings (PE) ratio is a widely used metric to gauge valuation. The PE ratio compares a company's share price to its per-share earnings, offering investors a sense of how much they are paying for each dollar of profit. Generally, higher growth prospects or lower risk can justify a higher PE ratio, while slower growth or increased uncertainty tends to bring the "normal" range downward.
Currently, Dutch Bros trades at a PE ratio of 143.2x. This is notably higher than both its hospitality industry average of 24.0x and the peer average of 35.9x. At first glance, this suggests the stock commands a hefty premium compared to its sector and direct competitors. However, context is key; simply comparing these numbers does not always tell the whole story, especially for companies with rapid growth or unique dynamics.
This is where the “Fair Ratio” comes in, calculated by Simply Wall St as 49.5x for Dutch Bros. This proprietary metric incorporates key factors such as earnings growth potential, risk profile, profit margin, company size, and industry considerations, providing a more tailored and holistic yardstick for valuation. Because of this, the Fair Ratio offers a more meaningful comparison than simply lining up Dutch Bros next to its peers or the industry as a whole.
Since Dutch Bros' actual PE ratio of 143.2x is well above the Fair Ratio of 49.5x, the evidence points to the stock being overvalued on this metric as well.
Result: OVERVALUED
Earlier we mentioned that there is an even better way to understand valuation, so let us introduce you to Narratives. A Narrative is the story you build around a company, combining your perspective on its future growth, risks, and opportunities with actual financial forecasts for revenue, earnings, and profit margins to estimate fair value. This approach lets you move beyond standard metrics and connect what you believe about a business with numbers that matter, tying the company’s story directly to a forecast and resulting valuation.
Narratives are both easy to create and widely used on Simply Wall St’s Community page, where millions of investors share and refine their outlooks. As new information such as news or earnings becomes available, Narratives update dynamically, ensuring your perspective stays relevant. Narratives empower you to decide when to buy or sell by comparing each fair value estimate to the market price, helping you understand not just what a company is worth, but why.
For example, some Dutch Bros investors are focused on rapid Sun Belt expansion and margin growth, setting a fair value near $92. Others, more concerned about headwinds from competition and cost pressures, target a figure closer to $73. Narratives make these perspectives visible and actionable, so you can find or build an outlook that fits your own story and strategy.
Do you think there's more to the story for Dutch Bros? Create your own Narrative to let the Community know!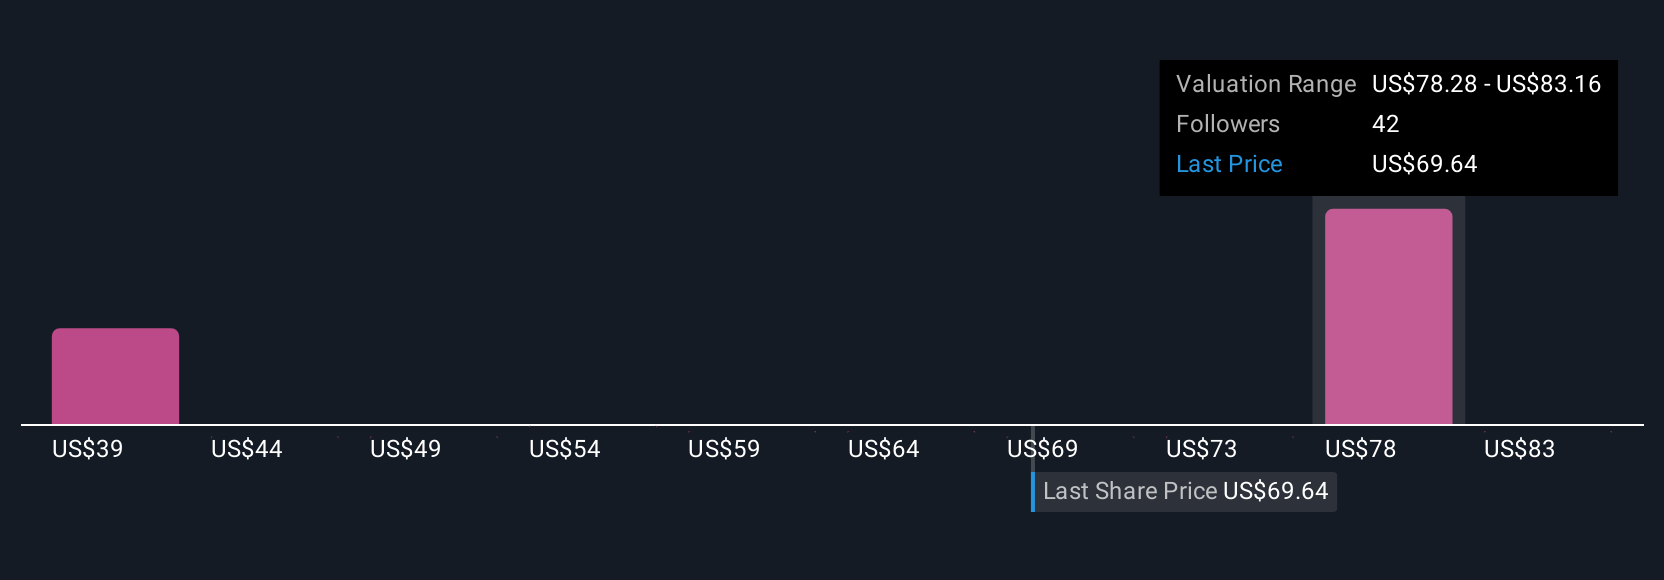
This article by Simply Wall St is general in nature. We provide commentary based on historical data and analyst forecasts only using an unbiased methodology and our articles are not intended to be financial advice. It does not constitute a recommendation to buy or sell any stock, and does not take account of your objectives, or your financial situation. We aim to bring you long-term focused analysis driven by fundamental data. Note that our analysis may not factor in the latest price-sensitive company announcements or qualitative material. Simply Wall St has no position in any stocks mentioned.
