Skyrocket to $8 Million: Jack Kellogg's Insider Tips for Aspiring Traders
SAUDI ARAMCO 2222.SA | 0.00 | |
TADAWUL GROUP 1111.SA | 0.00 | |
ACWA 2082.SA | 0.00 | |
PowerShares QQQ Trust,Series 1 QQQ | 0.00 | |
Apple Inc. AAPL | 0.00 |
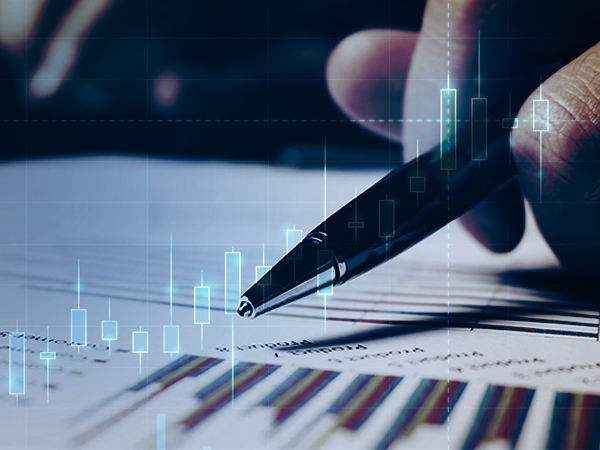
Trading in the stock market can seem like a dream, but for most traders, it remains just that—a dream. However, Jack Kellogg, a 24-year-old trader, turned this dream into reality by earning $8 million through day trading in 2020 and 2021.

Kellogg began his trading journey in 2017 with a modest starting capital of $7,500. He navigated various market conditions, including the pandemic crash in 2020, the bull market of 2021, and the bear market of 2022. His key takeaway: simplicity and flexibility are essential in trading.
“There’s a principle called KISS: ‘Keep It Simple, Stupid.’ I don’t think you need fancy technical indicators to make money. I use basic trend lines, support, resistance, and volume. These are my go-to tools,” Kellogg explained. “Overcomplicating indicators can cloud your judgment, leading you to trade based on them rather than actual price movements.”
This approach helped him become a versatile trader, adept at both long and short positions, even thriving during the bear market of 2022. Tax records reviewed by Insider confirm his impressive $8 million earnings from day trading in 2020 and 2021, with his income accelerating from $1.6 million in 2020 to $6.5 million in 2021.
Starting with just $7,500, Kellogg initially lost a few hundred dollars, realizing he didn’t know how to trade effectively. He turned to paper trading to hone his skills and enrolled in an online course funded by his parents, created by Timothy Sykes, a former penny stock trader known for turning his gift money into over a million dollars in trading profits. Through this course, Kellogg developed his skills and patience, gradually forming his unique trading style.
Although his early attempts weren’t successful, he gained valuable experience across different market types. In his first year, he accumulated knowledge through paper trading, learning from initial losses.
Today, Kellogg draws parallels between 2017 and the current market, noting similar volatility patterns unless trading hot thematic stocks like those related to artificial intelligence (AI). This reminds him of trading bitcoin-related stocks during the cryptocurrency bull run of 2017-2018.
“The rise of bitcoin from $1,000 to $20,000 back then is similar to what I see in AI stocks now. AI is a hot topic among media and traders,” Kellogg remarked.
This hype creates numerous opportunities for both long and short trades, as AI stocks often experience overbuying. You can ride the upward trend and then short the pullback when the prices become too inflated.
From “Hype” to Technical Analysis
Initially influenced by market buzz, Kellogg eventually shifted focus to technical indicators and chart patterns he was familiar with. His strategy revolves around four key indicators:
1. VWAP (Volume Weighted Average Price)
VWAP helps him avoid entering trades at unfavorable prices by showing the average buy price adjusted for volume. He uses it to determine entry and exit points.
His principle: If the price is above the VWAP line, he doesn’t buy since it indicates buying higher than average. Similarly, he avoids shorting when the price is below VWAP.
He also uses VWAP for profit-taking or cutting losses. For example, if he shorts a stock at $9 and VWAP is at $7.5, he might close the position around $7.5 to secure profits.
Example: On January 5, 2023, he shorted AMTD at $2.50 when VWAP was around $2.22, closing at $2.25 for a 10% gain.
2. Linear Regression Indicator
This indicator helps him assess the direction and potential reversal points of price trends. It consists of three lines overlaid on candlestick charts, representing price range, volatility, and average value, boosting his confidence in trend predictions.
If the price breaks the upper band, it suggests overvaluation; breaking the lower band indicates undervaluation. “A stock moving well within a channel makes its price trend more predictable,” Kellogg said.
3. Volume
Volume indicates the number of shares traded in a given period, serving as a clue for potential reversals. It helps Kellogg identify when many traders might be on the wrong side, prompting a directional shift.
“A surge in volume near the day’s high often means many are buying in, possibly signaling an upcoming reversal.”
4. Support and Resistance
Support levels are where prices tend to bounce back, while resistance levels are where prices tend to fall. Kellogg observes volume changes at these levels to confirm their strength and monitors how long prices linger at these points.
He notes that if prices fluctuate within a range for 30 minutes to an hour, it often indicates strong support or resistance.
“You’ll see ‘bouncing ball’ price behavior—like bouncing from $7 to $8, then $7.30 to $7.50, and $7.40 to $7.10, eventually breaking $7 support. If $7 becomes new resistance, prices might fall further.”
In trades supported by thematic logic, he allows more price fluctuation rather than strictly adhering to stop-losses as in technical day trading.
“I aim for larger percentage gains because these patterns often exceed expectations as everyone rushes to buy stocks hyped as ‘the next big trend.’”
Ultimately, Kellogg emphasizes:
“Price action is king. Even if your logic is great, if the price moves against you, it’s time to cut your losses.”
Avoiding Blind Reliance on Indicators
Despite relying on technical indicators, Kellogg stresses he never makes decisions based solely on them. If price action contradicts his trading logic, he cuts losses, showcasing the flexibility in his strategy.
He never fully depends on any indicator and doesn’t blame losses on technical tools:
“If prices keep dropping, I cut losses; if they keep rising, I close shorts. I won’t let an indicator mislead me into large losses.”
He starts with small positions (10% to 15% of the planned total) to observe trends, gradually increasing as entry points are confirmed.
“I ensure I buy when stocks dip. If holding for days, weeks, or months, I prefer buying during panic selling,” he said.
He believes everyone can access the same data, but the key lies in how you use it. Most traders’ issues are psychological—without discipline, even the best strategies and indicators can lead to poor decisions.
“Many haven’t invested enough effort to train their emotional control,” he concluded.
He also underscores the importance of emotional control. Regardless of how good the strategy or accurate the indicators are, without discipline, trading won’t succeed.
His Secret to Success
Kellogg’s success epitomizes the “simplicity + flexibility + discipline” trading approach. His journey from novice to millionaire offers valuable lessons for aspiring traders, highlighting the importance of mastering key indicators, adapting to changing markets, and managing emotions.
Long-Term Investing: Better Suited for Most
Day trading isn’t for everyone. The intense price fluctuations can be unsettling, especially for those unfamiliar with fundamentals. For many, long-term investing may offer a simpler, more relaxed path.