StepStone Group (STEP) Q3 Loss Of US$1.55 EPS Reinforces Profitability Concerns
StepStone Group, Inc. Class A STEP | 46.90 46.90 | -0.32% 0.00% Pre |
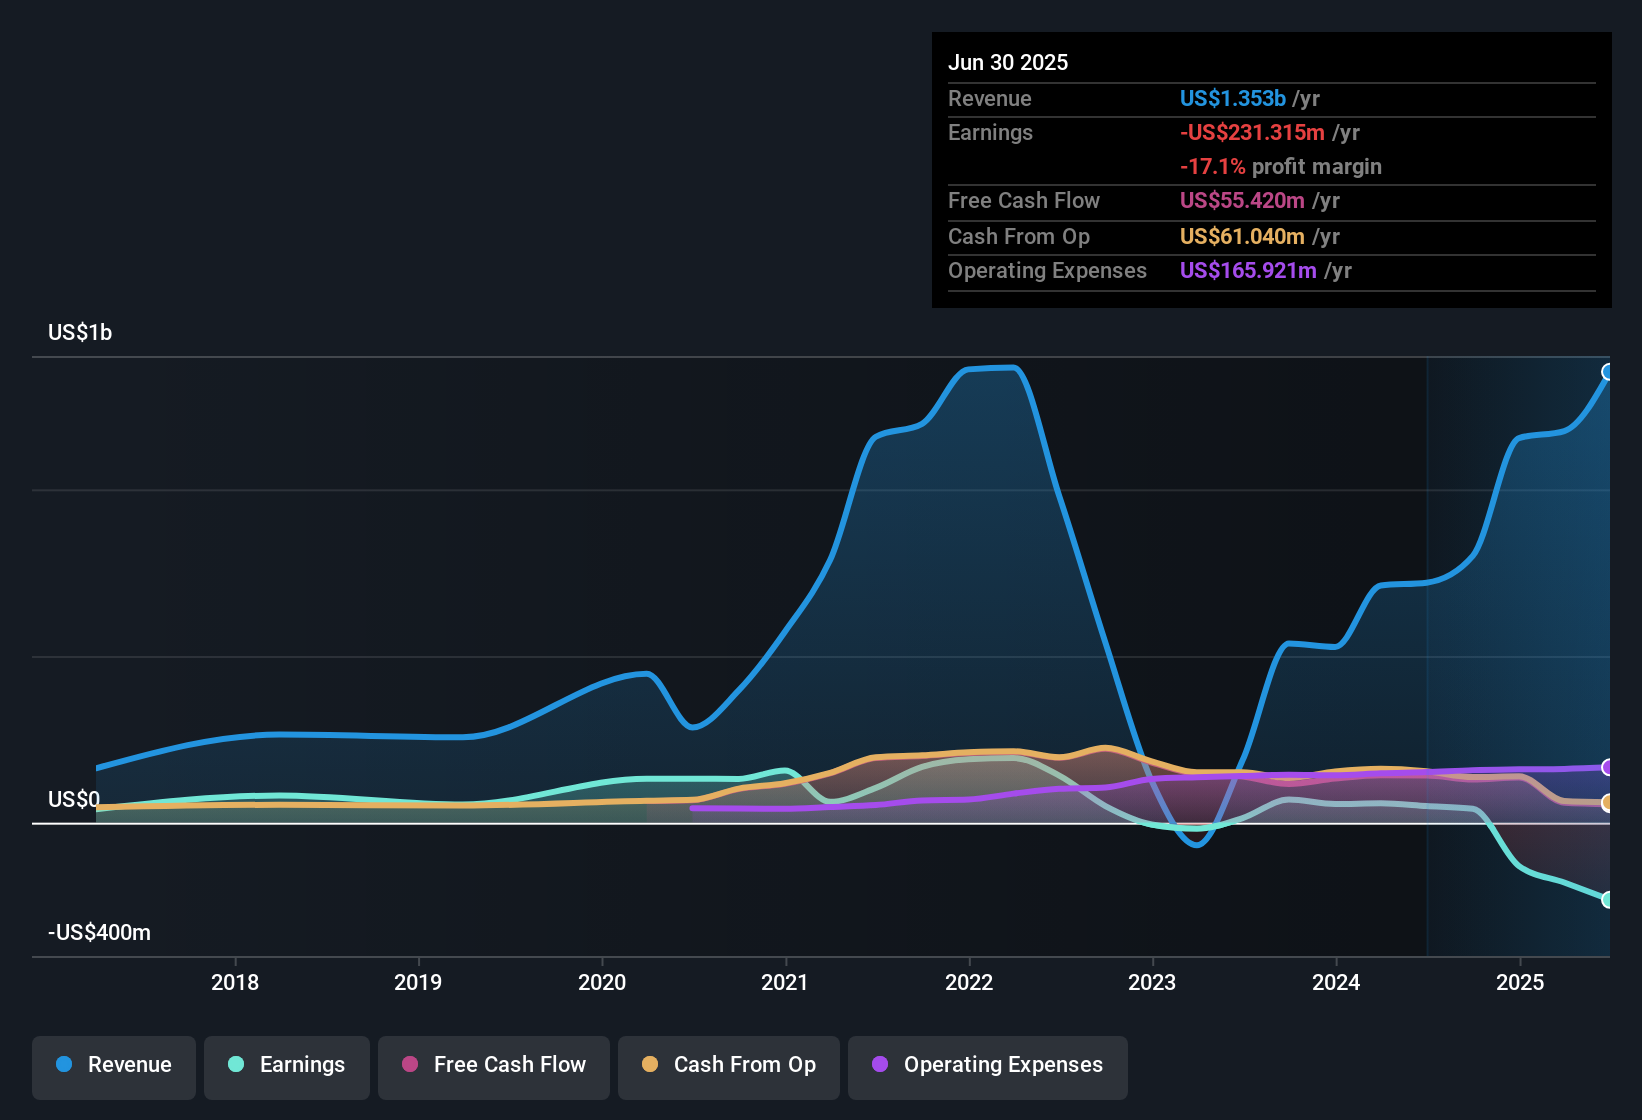
StepStone Group (STEP) has reported Q3 2026 revenue of US$586.5 million with a basic EPS loss of US$1.55, while trailing twelve month revenue stands at US$1.8 billion and EPS at a loss of US$7.01. Over recent quarters, the company has seen revenue move from US$377.7 million in Q4 2025 to US$364.3 million in Q1 2026, US$454.2 million in Q2 2026, and now US$586.5 million in Q3 2026. Over the same period, quarterly EPS has shifted from a loss of US$0.24 to losses of US$0.49, US$4.66 and US$1.55 respectively. For investors, the latest print highlights how revenue scale is interacting with ongoing losses and how that is feeding through to margins.
See our full analysis for StepStone Group.With the headline numbers on the table, the next step is to see how this earnings profile lines up with the prevailing narratives about StepStone's growth, profitability, and risk over the past year.
AUM builds toward US$132.8b base
- Across recent quarters, assets under management moved from US$121.4b at the start of Q1 2026 to US$132.8b at the end of Q2, with net inflows of US$5.0b in Q1 and US$6.1b in Q2 helping support a trailing twelve month revenue line of US$1.8b.
- Bulls often point to AUM growth as a sign of franchise strength, but the earnings record here adds tension to that view:
- While higher AUM helps underpin fee revenue, trailing twelve month net income is a loss of US$546.5 million, so the larger asset base is not yet translating into overall profitability.
- Over the past five years, losses have grown at an annualized rate of 74.5%, which sits awkwardly next to the idea that scale alone will eventually drive cleaner earnings.
Losses widen despite US$1.8b revenue
- On a trailing twelve month basis, StepStone generated US$1.8b of revenue but recorded a net income loss of US$546.5 million and a basic EPS loss of US$7.01, with individual quarterly losses ranging from US$18.5 million in Q4 2025 to US$366.1 million in Q2 2026 and US$123.5 million in Q3 2026.
- Bears focus on this profitability profile when they argue the business model is under pressure, and the recent numbers back several of those concerns:
- Over the last five years, losses have grown at a very high pace while the last six reported quarters show only one period with positive net income of US$17.6 million in Q2 2025, pointing to a pattern of loss making rather than isolated weak quarters.
- Earnings comparisons to multi year averages are described as not meaningful because the company is currently loss making, which fits with the trailing EPS loss of US$7.01 and repeated quarterly losses through 2025 and 2026.
Cheaper P/S meets weak dividend cover
- StepStone is trading on a P/S of 2.8x compared with a cited peer and US capital markets industry average of 3.6x, while at the same time paying a 2.43% dividend yield that is not covered by either earnings or free cash flow given the trailing twelve month net loss of US$546.5 million.
- What stands out in the general market view is how valuation and income appeal are balanced against cash flow strain:
- The lower P/S ratio suggests investors are already pricing in slower revenue growth of about 3% per year versus a cited 10.2% for the broader US market, which aligns with concerns about the company’s growth profile.
- The dividend’s weak coverage, alongside multi year loss growth of 74.5% annually, directly challenges any bullish argument that income from the stock is comfortably supported by the current earnings and cash generation base.
For a fuller picture of how these themes fit into the broader story and different investor viewpoints on StepStone, it helps to see how others are weighing the same numbers in their write ups about the company. Curious how numbers become stories that shape markets? Explore Community Narratives
Next Steps
Don't just look at this quarter; the real story is in the long-term trend. We've done an in-depth analysis on StepStone Group's growth and its valuation to see if today's price is a bargain. Add the company to your watchlist or portfolio now so you don't miss the next big move.
See What Else Is Out There
StepStone is contending with repeated losses, weak dividend cover and a history of growing losses that make its income appeal and risk profile look fragile.
If that mix of ongoing losses and uncovered dividends feels uncomfortable, take a few minutes to size up alternatives in our 87 resilient stocks with low risk scores that focus on resilience first.
This article by Simply Wall St is general in nature. We provide commentary based on historical data and analyst forecasts only using an unbiased methodology and our articles are not intended to be financial advice. It does not constitute a recommendation to buy or sell any stock, and does not take account of your objectives, or your financial situation. We aim to bring you long-term focused analysis driven by fundamental data. Note that our analysis may not factor in the latest price-sensitive company announcements or qualitative material. Simply Wall St has no position in any stocks mentioned.