Tenable Holdings (TENB) Near Breakeven EPS Rekindles Bullish Margin Improvement Narratives
TENABLE HOLDINGS, INC. TENB | 19.03 19.03 | +0.53% 0.00% Post |
Tenable Holdings (TENB) just wrapped up FY 2025 with Q4 revenue of US$260.5 million and basic EPS of roughly US$0.01 loss, compared with Q4 FY 2024 revenue of US$235.7 million and basic EPS of about US$0.02. Over the last six quarters, revenue has moved from US$227.1 million in Q3 FY 2024 through US$252.4 million in Q3 FY 2025 to US$260.5 million in the latest quarter. Basic EPS has ranged between a loss of about US$0.19 in Q1 FY 2025 and a profit of about US$0.02 in Q3 FY 2025 before landing just below breakeven in Q4. This sets up a results season in which investors are likely to focus on how quickly margins can firm up from here.
See our full analysis for Tenable Holdings.With the headline numbers on the table, the next step is to see how this earnings print lines up with the main Tenable narratives that investors have been talking about over the past year and where those storylines might need updating.
TTM loss of US$36.1 million keeps profitability in focus
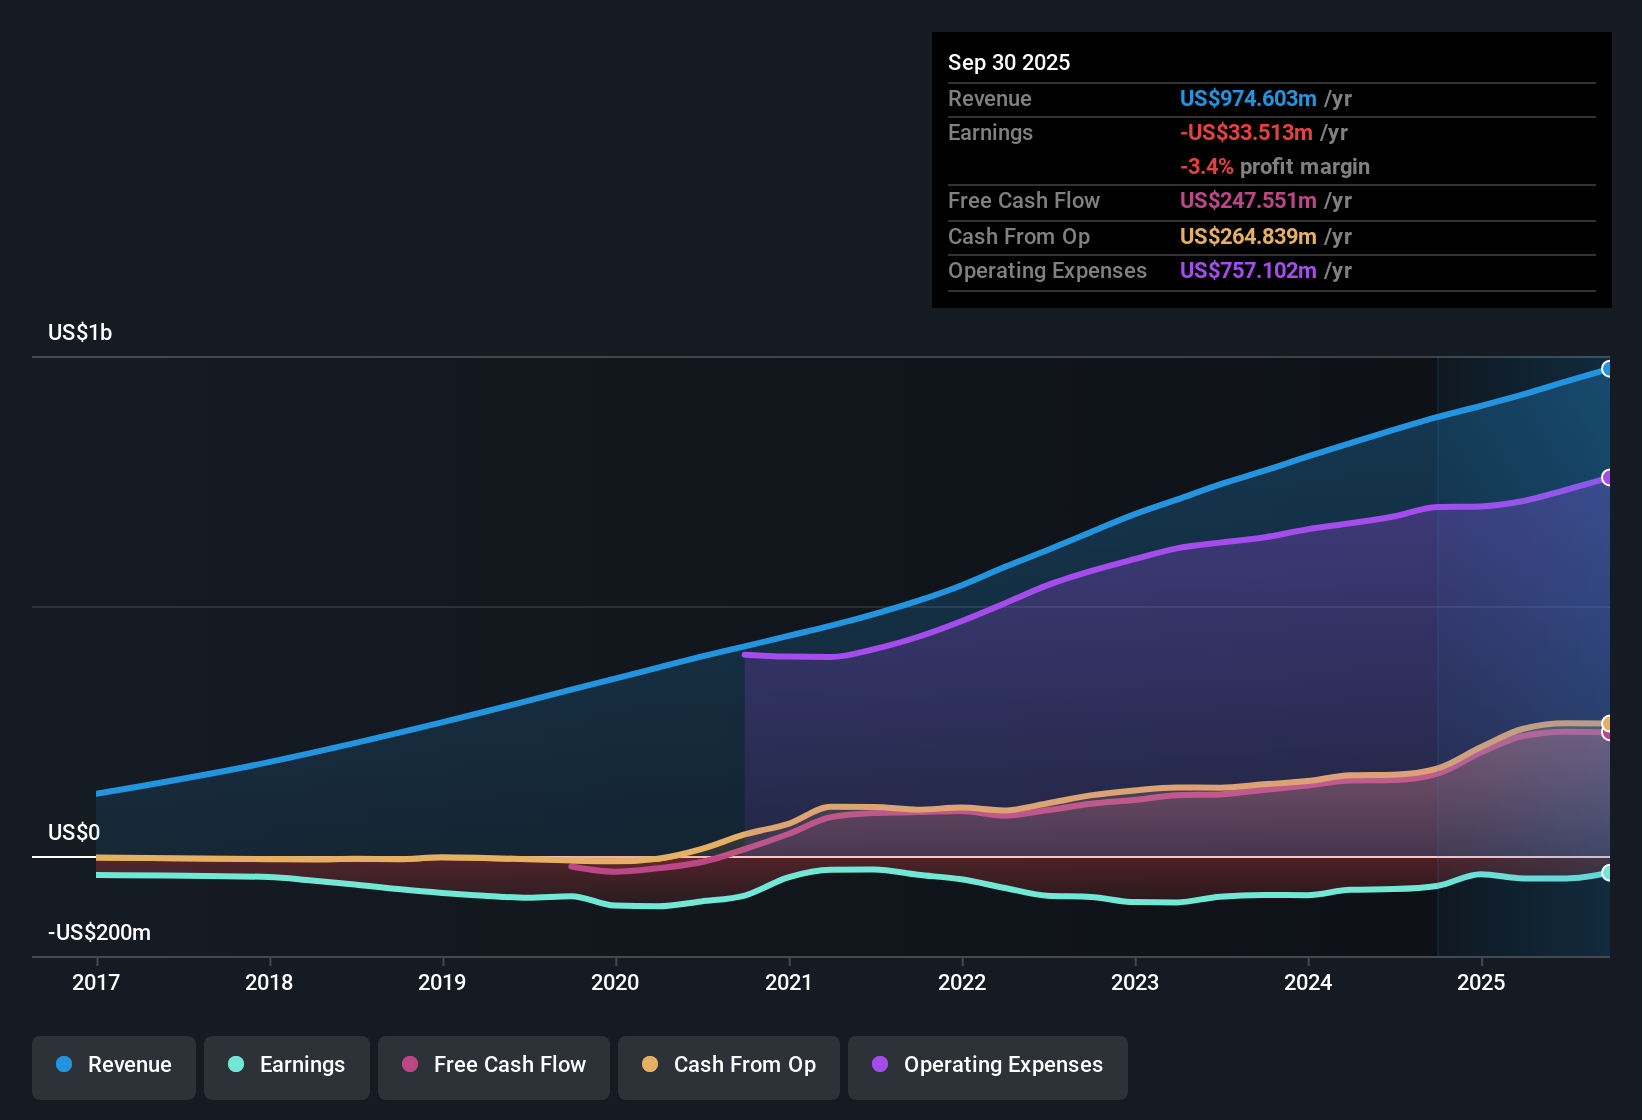
- On a trailing 12 month basis, Tenable booked a net income loss of US$36.1 million on US$999.4 million of revenue, with basic EPS at a loss of US$0.30 over that period.
- What stands out for a bullish view that focuses on future earnings growth is that, while the business is currently unprofitable, the data shows losses narrowing modestly over the past five years alongside trailing revenue just under US$1.0b. This heavily supports the idea that there is an operating base to scale even though margins on the latest 12 month numbers are still negative.
- Supporters of this bullish angle point to the forecast that earnings could grow about 75.3% per year with an expectation of profitability within roughly three years, contrasted against the current trailing loss of US$36.1 million that still needs to be worked through.
- The same data shows revenue growth forecast at around 7% a year compared with a 10.3% benchmark for the US market. As a result, the bullish case leans more on future margin improvement than on outpacing the market on top line growth.
Forecasts of rapid earnings improvement versus a still loss making trailing 12 months create a clear tension that bullish investors will want to understand more deeply. 📊 Read the full Tenable Holdings Consensus Narrative.
Q4 swings back near breakeven after earlier FY 2025 losses
- Within FY 2025, Tenable moved from a Q1 net income loss of US$22.9 million, through a Q2 loss of US$14.7 million and a Q3 profit of US$2.3 million, to a small Q4 net loss of US$0.7 million. Basic EPS ranged from a loss of US$0.19 in Q1 to a profit of US$0.02 in Q3 and a near breakeven loss of about US$0.01 in Q4.
- For investors leaning bullish, this pattern of quarterly results shows earnings bouncing around breakeven on a quarterly basis while the trailing 12 month figures still show a loss. This partly supports the idea that profitability may be within reach but also reminds you that the company has not yet put together a full year of positive net income.
- Backers of the bullish stance might highlight that the shift from a US$22.9 million loss in Q1 FY 2025 to a US$0.7 million loss in Q4 came alongside revenue moving from US$239.1 million to US$260.5 million, indicating the business handled higher revenue without returning to the larger losses seen earlier in the year.
- On the other hand, skeptics can point to the fact that the trailing 12 month EPS is still a loss of US$0.30 and that quarterly profitability has not been consistent. This means the bullish expectation of strong future earnings growth is not yet reflected in a clean run of positive results.
P/S of 2.3x and DCF fair value of US$53.87 vs price of US$19.76
- The data shows Tenable trading on a P/S of 2.3x compared with 2.8x for peers and 3.9x for the wider US software group, while a DCF fair value of about US$53.87 per share sits well above the current share price of US$19.76.
- Supporters with a bullish mindset often point to this combination of a lower P/S relative to peers and a DCF fair value far above the current price as evidence that the market is not fully crediting the business. Yet the same dataset also highlights that Tenable is still unprofitable over the last 12 months and that forecast revenue growth of around 7% trails the 10.3% US market benchmark, so the valuation gap implied by the DCF model depends heavily on the forecast margin and earnings improvements materializing.
- The bullish angle leans on the idea that if earnings do move toward the forecast path, a P/S of 2.3x and the wide gap between US$19.76 and the DCF fair value of US$53.87 leave room for the valuation to adjust, whereas the current negative trailing
Next Steps
Don't just look at this quarter; the real story is in the long-term trend. We've done an in-depth analysis on Tenable Holdings's growth and its valuation to see if today's price is a bargain. Add the company to your watchlist or portfolio now so you don't miss the next big move.
See What Else Is Out There
Tenable is still working through a trailing 12 month loss of US$36.1 million, inconsistent quarterly profitability, and forecast revenue growth that trails the broader US market.
If that mix of losses, uneven earnings and slower forecast growth feels a bit uncomfortable, you may want to compare it with 79 resilient stocks with low risk scores that focus on companies with more resilient profiles.
This article by Simply Wall St is general in nature. We provide commentary based on historical data and analyst forecasts only using an unbiased methodology and our articles are not intended to be financial advice. It does not constitute a recommendation to buy or sell any stock, and does not take account of your objectives, or your financial situation. We aim to bring you long-term focused analysis driven by fundamental data. Note that our analysis may not factor in the latest price-sensitive company announcements or qualitative material. Simply Wall St has no position in any stocks mentioned.
- The bullish angle leans on the idea that if earnings do move toward the forecast path, a P/S of 2.3x and the wide gap between US$19.76 and the DCF fair value of US$53.87 leave room for the valuation to adjust, whereas the current negative trailing