Stocks slide to start week as traders brace for Nvidia earnings, jobs data
Sahm Platform 17/11 14:38
Understanding Amazon.com's Position In Broadline Retail Industry Compared To Competitors
Amazon.com, Inc. AMZN | 0.00 |
In today's rapidly changing and highly competitive business world, it is imperative for investors and industry observers to carefully assess companies before making investment choices. In this article, we will undertake a comprehensive industry comparison, evaluating Amazon.com (NASDAQ:AMZN) vis-à-vis its key competitors in the Broadline Retail industry. Through a detailed analysis of important financial indicators, market standing, and growth potential, our goal is to provide valuable insights and highlight company's performance in the industry.
Amazon is the leading online retailer and marketplace for third party sellers. Retail related revenue represents approximately 75% of total, followed by Amazon Web Services' cloud computing, storage, database, and other offerings (15%), advertising services (5% to 10%), and other the remainder. International segments constitute 25% to 30% of Amazon's non-AWS sales, led by Germany, the United Kingdom, and Japan.
| Company | P/E | P/B | P/S | ROE | EBITDA (in billions) | Gross Profit (in billions) | Revenue Growth |
|---|---|---|---|---|---|---|---|
| Amazon.com Inc | 36.37 | 7.75 | 3.69 | 5.79% | $36.48 | $78.69 | 8.62% |
| Alibaba Group Holding Ltd | 15.28 | 1.93 | 1.98 | 1.23% | $21.8 | $90.83 | 6.57% |
| PDD Holdings Inc | 11.26 | 3.25 | 2.77 | 4.59% | $16.09 | $54.73 | 10.21% |
| MercadoLibre Inc | 62.98 | 25.94 | 5.80 | 10.56% | $0.92 | $2.77 | 36.97% |
| Coupang Inc | 220.07 | 12.79 | 1.82 | 2.53% | $0.36 | $2.32 | 11.16% |
| JD.com Inc | 8.05 | 1.46 | 0.30 | 4.6% | $14.27 | $47.85 | 15.78% |
| eBay Inc | 17.73 | 6.87 | 3.50 | 9.95% | $0.77 | $1.86 | 1.13% |
| Ollie's Bargain Outlet Holdings Inc | 40.85 | 4.71 | 3.51 | 2.78% | $0.07 | $0.24 | 13.35% |
| Vipshop Holdings Ltd | 7.81 | 1.39 | 0.54 | 4.85% | $2.45 | $6.08 | -4.98% |
| Dillard's Inc | 11.50 | 3.50 | 1.01 | 8.97% | $0.26 | $0.69 | -1.64% |
| MINISO Group Holding Ltd | 16.23 | 3.68 | 2.25 | 3.98% | $0.65 | $1.96 | 18.89% |
| Macy's Inc | 5.73 | 0.69 | 0.14 | 0.84% | $0.31 | $2.0 | -4.14% |
| Savers Value Village Inc | 73.36 | 3.85 | 1.10 | -1.13% | $0.03 | $0.2 | 4.51% |
| Kohl's Corp | 7.74 | 0.25 | 0.06 | -0.4% | $0.23 | $1.4 | -4.41% |
| Hour Loop Inc | 135 | 8.16 | 0.34 | 11.93% | $0.0 | $0.01 | 4.68% |
| Average | 45.26 | 5.6 | 1.79 | 4.66% | $4.16 | $15.21 | 7.72% |
By analyzing Amazon.com, we can infer the following trends:
A Price to Earnings ratio of 36.37 significantly below the industry average by 0.8x suggests undervaluation. This can make the stock appealing for those seeking growth.
It could be trading at a premium in relation to its book value, as indicated by its Price to Book ratio of 7.75 which exceeds the industry average by 1.38x.
The stock's relatively high Price to Sales ratio of 3.69, surpassing the industry average by 2.06x, may indicate an aspect of overvaluation in terms of sales performance.
The Return on Equity (ROE) of 5.79% is 1.13% above the industry average, highlighting efficient use of equity to generate profits.
The Earnings Before Interest, Taxes, Depreciation, and Amortization (EBITDA) of $36.48 Billion is 8.77x above the industry average, highlighting stronger profitability and robust cash flow generation.
The gross profit of $78.69 Billion is 5.17x above that of its industry, highlighting stronger profitability and higher earnings from its core operations.
The company's revenue growth of 8.62% is notably higher compared to the industry average of 7.72%, showcasing exceptional sales performance and strong demand for its products or services.
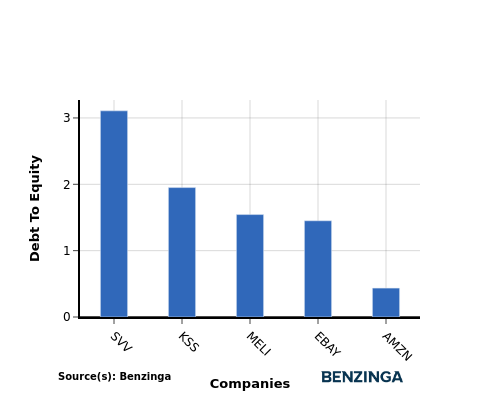
The debt-to-equity (D/E) ratio provides insights into the proportion of debt a company has in relation to its equity and asset value.
Considering the debt-to-equity ratio in industry comparisons allows for a concise evaluation of a company's financial health and risk profile, aiding in informed decision-making.
By evaluating Amazon.com against its top 4 peers in terms of the Debt-to-Equity ratio, the following observations arise:
When considering the debt-to-equity ratio, Amazon.com exhibits a stronger financial position compared to its top 4 peers.
This indicates that the company has a favorable balance between debt and equity, with a lower debt-to-equity ratio of 0.44, which can be perceived as a positive aspect by investors.
For Amazon.com, the PE, PB, and PS ratios indicate that the stock is relatively undervalued compared to its peers in the Broadline Retail industry. On the other hand, the high ROE, EBITDA, gross profit, and revenue growth suggest that Amazon.com is performing exceptionally well and outpacing its industry competitors in terms of profitability and growth potential.
This article was generated by Benzinga's automated content engine and reviewed by an editor.

