Weatherford International (WFRD) Margin Slippage To 8.8% Tests Bullish Earnings Narratives
Weatherford International plc Ordinary Shares - New WFRD | 96.35 96.35 | +1.53% 0.00% Post |
Weatherford International’s FY 2025 Earnings Snapshot
Weatherford International (WFRD) closed out FY 2025 with Q4 revenue of US$1.3b and basic EPS of US$1.92, backed by net income of US$138m. The company has seen quarterly revenue range from US$1,193m to US$1,341m across the last six reported periods, while basic EPS has moved between US$1.04 and US$2.14 over the same stretch. This provides a clear view of how the top and bottom lines have tracked through the cycle. With a trailing twelve month net profit margin of 8.8% versus 9.2% a year earlier, the focus now is on how investors weigh slightly softer margins against the growth and reward drivers highlighted in the latest release.
See our full analysis for Weatherford International.With the headline numbers on the table, the next step is to see how these results line up against the widely followed narratives around Weatherford’s growth, risk profile, and long term earnings story.
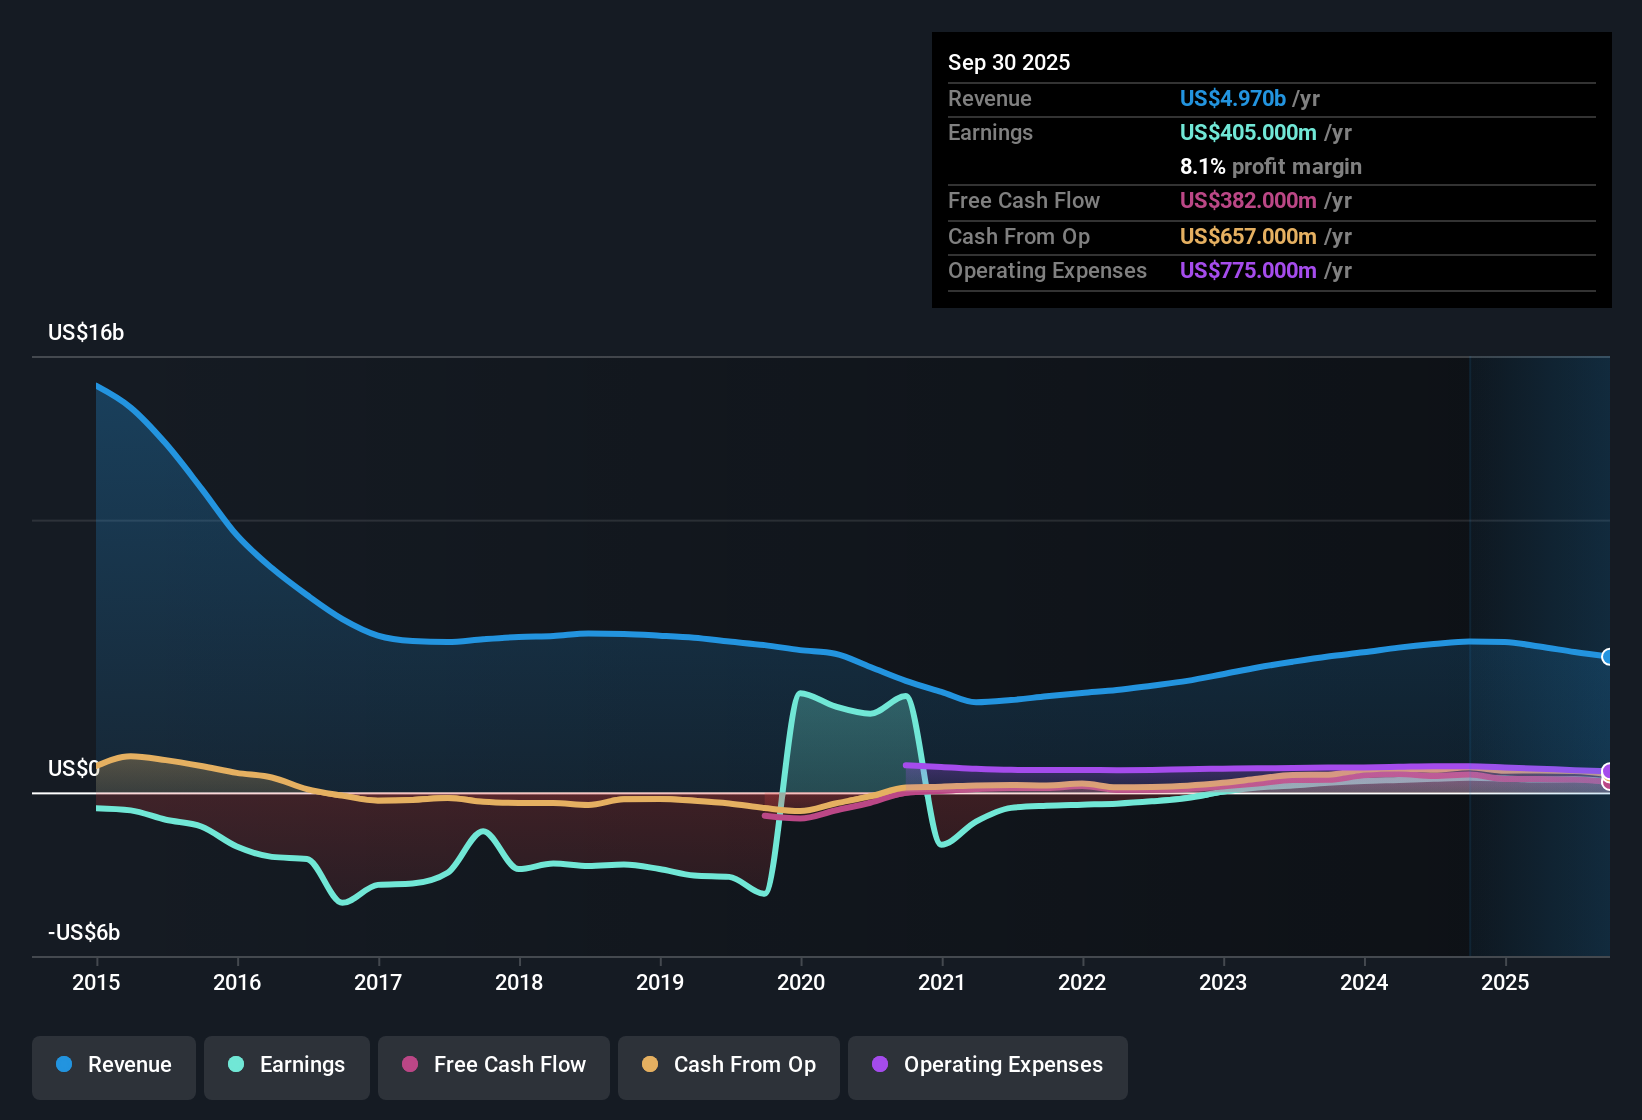
Margins Soften To 8.8% On Trailing Basis
- On a trailing basis, Weatherford earned US$431 million of net income on US$4.9b of revenue, which works out to an 8.8% net profit margin compared with 9.2% a year earlier.
- What stands out for a bullish view is that trailing 12 month EPS of US$5.97 and net income of US$431 million sit against commentary that earnings quality is high. However, the margin slip from 9.2% to 8.8% shows that even with solid profitability, pressure on margins can appear at the same time that longer term earnings growth has been strong.
- Bulls often point to the 71.6% yearly earnings growth rate over the past five years and the high quality label on those earnings, but the most recent 12 month margin of 8.8% and the step down from the prior year highlight that shorter term performance can move differently from that multi year trend.
- Supporters who focus on efficiency need to weigh that 8.8% margin against quarterly net income figures that ranged from US$76 million to US$157 million over the last six reported quarters, which shows that profitability has been solid but not on a straight line.
P/E Of 16.6x Versus Higher Industry Averages
- Weatherford is referenced with a trailing P/E of 16.6x, which sits below the US Energy Services industry average of 23.5x and below a peer average of 31.7x while the shares trade around US$99.97.
- Critics who take a more bearish stance might argue that a lower P/E simply reflects slower forecasts, and the data partly backs that up because earnings are forecast to grow about 8.6% per year and revenue about 3.3% per year, which is described as slower than the broader US market. At the same time, that same set of figures also shows a stock that is about 68.5% below the supplied fair value estimate of US$317.57 based on DCF fair value.
- Bears can point to that below market growth profile and the recent softening in trailing profit margin to explain why the P/E sits under industry and peer levels even with a DCF fair value that is much higher than the current share price.
- Investors who focus on valuation metrics will notice that a 16.6x P/E and a price flagged as well below a DCF fair value of US$317.57 create a clear gap between how the company is priced and what those models suggest, which some readers may see as a potential upside signal if the forecasts are met.
Trailing Revenue Around US$4.9b With Forecast 3.3% Growth
- Over the latest trailing 12 months, revenue is listed at US$4.9b, and forward looking data references expected revenue growth of about 3.3% per year with earnings growth of about 8.6% per year off that base.
- General market opinion around this type of setup is that steadier revenue paired with faster earnings growth can support the idea of operating discipline, and the numbers here partly fit that, since trailing EPS of US$5.97 is backed by US$431 million of net income on US$4.9b of sales. The same dataset also flags that the most recent year showed negative earnings growth versus the five year trend of 71.6% per year, which reminds you that the path from revenue to profit has not been perfectly smooth.
- Supporters of the growth story can highlight that earnings are expected to grow faster than the 3.3% revenue pace, but they also need to account for the fact that trailing revenue has eased from US$5.5b a year earlier to US$4.9b now according to the provided data.
- Readers cautious on near term momentum may focus on this mix of slower forecast growth and the recent step down in trailing earnings versus the longer run 71.6% per year figure when thinking about how durable that earnings profile might be.
Next Steps
Don't just look at this quarter; the real story is in the long-term trend. We've done an in-depth analysis on Weatherford International's growth and its valuation to see if today's price is a bargain. Add the company to your watchlist or portfolio now so you don't miss the next big move.
See What Else Is Out There
Weatherford’s softer 8.8% trailing margin, recent step down in earnings versus its multi year trend, and slower forecast revenue growth all point to less consistent momentum.
If that mix of margin pressure and uneven earnings makes you want steadier stories, use our stable growth stocks screener (2178 results) to focus on companies with more consistent revenue and profit trends across cycles.
This article by Simply Wall St is general in nature. We provide commentary based on historical data and analyst forecasts only using an unbiased methodology and our articles are not intended to be financial advice. It does not constitute a recommendation to buy or sell any stock, and does not take account of your objectives, or your financial situation. We aim to bring you long-term focused analysis driven by fundamental data. Note that our analysis may not factor in the latest price-sensitive company announcements or qualitative material. Simply Wall St has no position in any stocks mentioned.