
Please use a PC Browser to access Register-Tadawul
Get It
What Recent AI Announcements Mean for Zoom’s Valuation in 2025
Zoom Video Communications ZM | 86.83 | +0.34% |
Deciding what to do with your Zoom Communications stock these days feels a little like trying to tune in to the right frequency, with so many signals flying around. After the wild swings of recent years, you might be wondering if now is the right time to buy, hold, or even walk away. The stock price, lately hovering around $73, has been on a bit of a roller coaster, down just over 10% year-to-date, but up about 7.5% in the past year. That back-and-forth movement says a lot about shifting perceptions of Zoom's growth prospects and the risks the company faces.
What stands out, though, is that Zoom isn’t just drifting. The company has been quietly building revenue and growing net income at an annual clip of about 3%. Analysts still see more upside, with the stock trading at a roughly 24% discount to their price target, and the intrinsic valuation indicators suggest an even steeper discount of over 34%. In terms of value, Zoom currently boasts a perfect valuation score of 6 out of 6, meaning it looks undervalued according to every one of the six standard checks investors use to identify a bargain.
So, how do these different valuation methods actually stack up in Zoom's case, and is there more to the story than what the numbers alone can show? Let’s break down each approach and see how Zoom measures up, with an eye toward an even more insightful way to think about what this all means for your investment decisions.
Zoom Communications delivered 7.5% returns over the last year. See how this stacks up to the rest of the Software industry.The Discounted Cash Flow (DCF) model focuses on future expectations, taking Zoom’s expected cash flows and calculating their present value. This approach helps investors estimate the business's intrinsic worth independently of market volatility.
Currently, Zoom Communications generates about $1.72 billion in Free Cash Flow annually. Projections indicate modest but steady growth, with annual Free Cash Flow forecasted to reach approximately $2.04 billion by 2030. When these future cash flows are analyzed using a 2 Stage Free Cash Flow to Equity model and properly discounted, the estimated fair value comes to $111.58 per share.
With shares trading near $73, these figures indicate that Zoom stock may be trading at a 34.4% discount to its intrinsic value based on projected cash flows. This suggests the share price could be appealing relative to the company’s anticipated performance.
Result: UNDERVALUED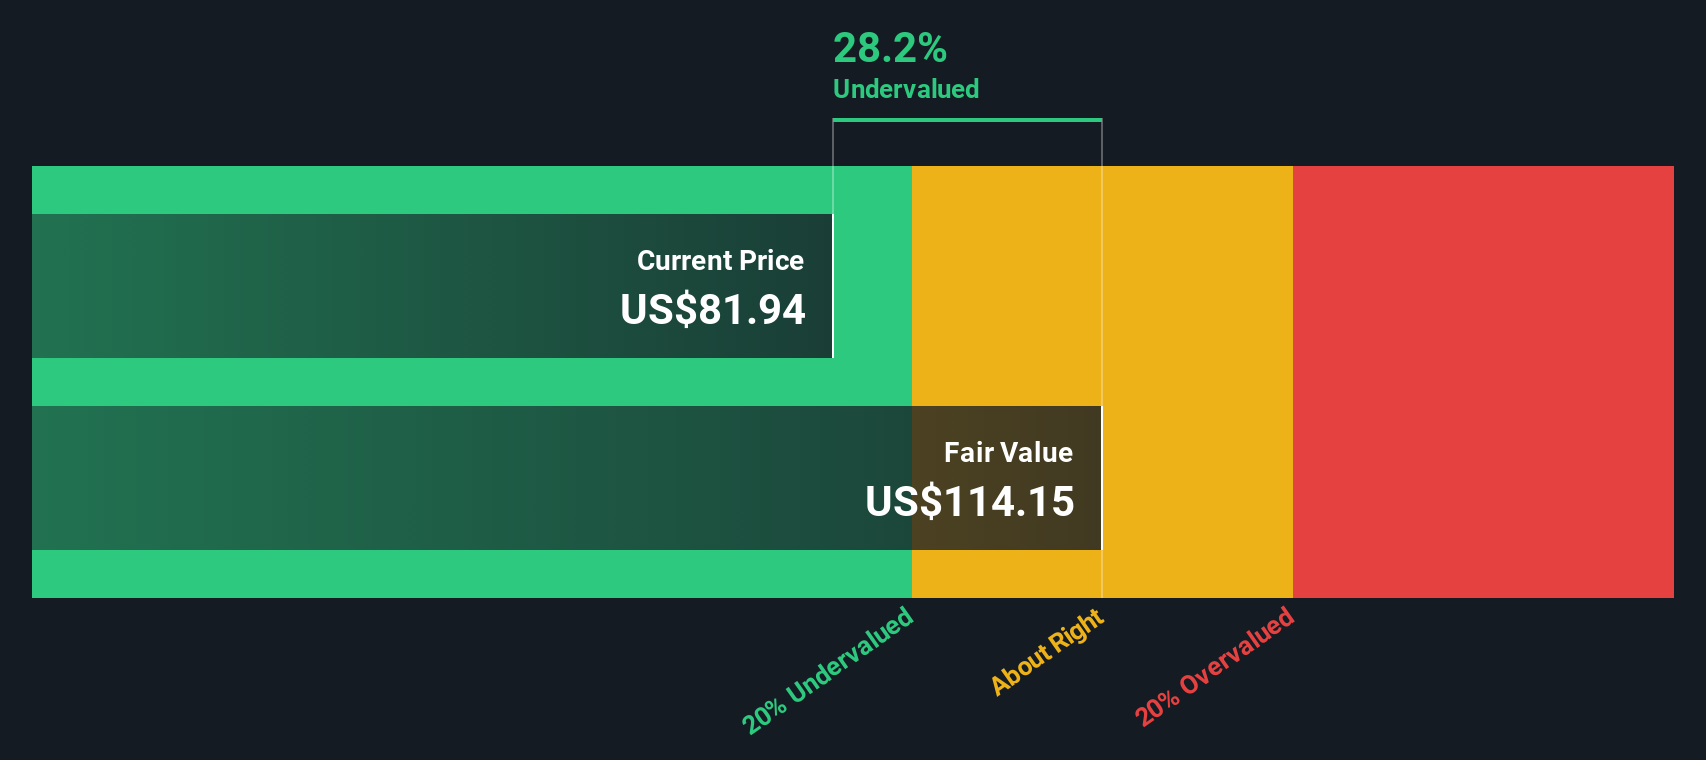
For companies that are consistently profitable like Zoom Communications, the Price-to-Earnings (PE) ratio is a popular and relevant metric for assessing valuation. The PE ratio quickly tells you how much investors are willing to pay today for each dollar of current earnings. It serves as a barometer for market sentiment around the company’s future prospects.
It’s important to note that a “normal” or “fair” PE ratio depends not just on current profits, but also on expectations for future growth, perceived risk, and how the company compares to its industry. Fast-growing, lower-risk software companies typically justify higher PE ratios, while slower or riskier ones tend to trade at lower multiples.
At present, Zoom’s PE ratio is roughly 21.1x. For context, the average for similar software industry peers is around 35.4x, with the broader peer group at 61.8x. Simply Wall St’s Fair Ratio for Zoom, which blends factors like earnings growth, profit margins, and risk, is calculated at 30.3x. Since Zoom’s current PE is well below both its industry peers and the Fair Ratio, the stock appears to be undervalued by this measure.
Result: UNDERVALUED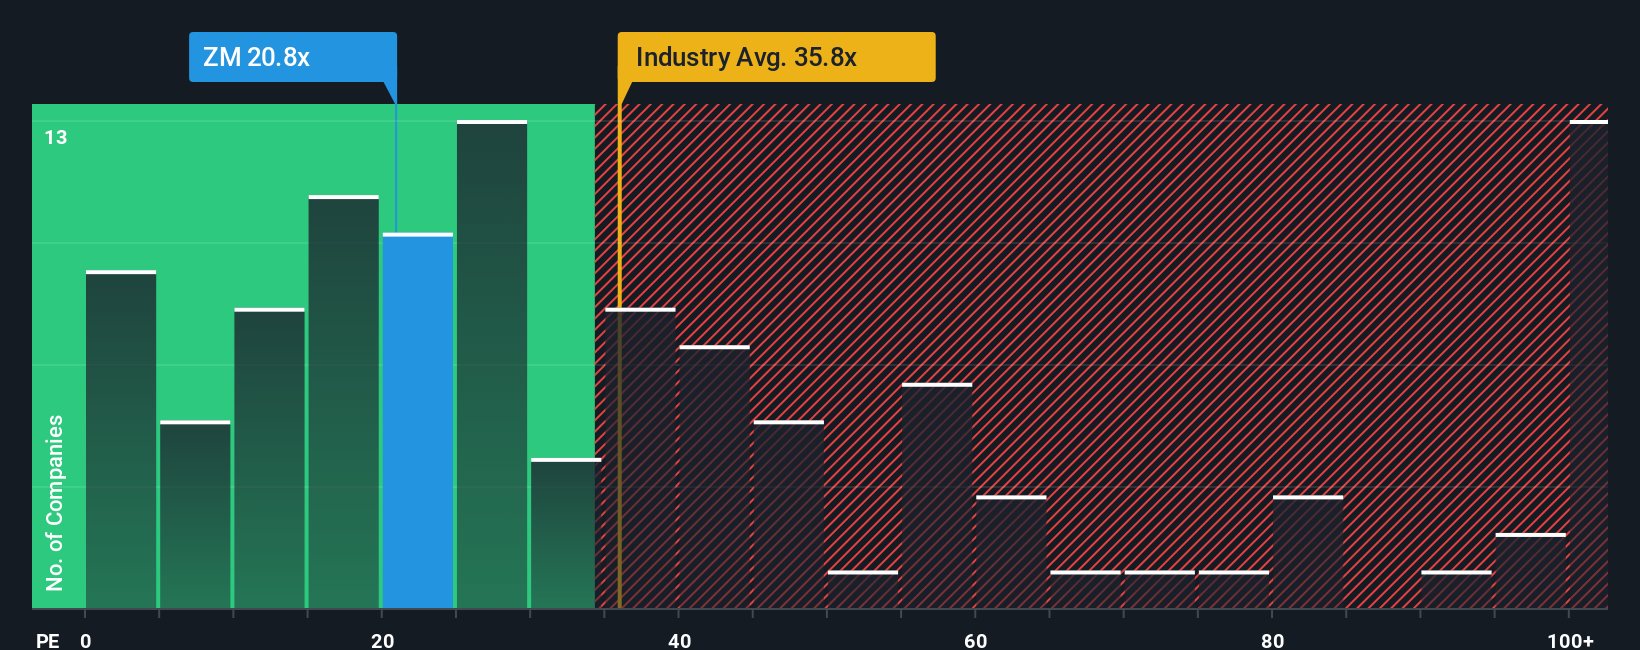
While numbers and ratios are useful, Narratives offer a more holistic approach to investing by letting you attach a story—your perspective—to the numbers driving a company's value, such as fair value estimates and forecasts of revenue, earnings, and margins.
A Narrative is how you link what’s happening in Zoom’s business to its financial forecasts, making sense of how new opportunities, challenges, or industry changes might shape its future and then translating that into a fair value that feels realistic to you.
With Narratives, you do not need to be a financial expert. Simply Wall St makes it easy to build and refine your story, using shared scenarios and insights from millions of investors to guide you through the valuation process.
Narratives help you make better decisions by clarifying when Zoom's share price offers value versus when it may be overvalued, as you compare your narrative-based fair value with the current market price.
Best of all, Narratives update automatically whenever important information is released, such as new earnings reports or business news, ensuring your investment thesis always stays fresh and relevant.
For example, some investors may believe Zoom’s new AI products and enterprise deals justify a fair value as high as $115 per share, while others with a more cautious outlook see it closer to $65. That is the power of building your own Narrative.
Do you think there's more to the story for Zoom Communications? Create your own Narrative to let the Community know!
This article by Simply Wall St is general in nature. We provide commentary based on historical data and analyst forecasts only using an unbiased methodology and our articles are not intended to be financial advice. It does not constitute a recommendation to buy or sell any stock, and does not take account of your objectives, or your financial situation. We aim to bring you long-term focused analysis driven by fundamental data. Note that our analysis may not factor in the latest price-sensitive company announcements or qualitative material. Simply Wall St has no position in any stocks mentioned.
