Williams Companies (WMB) just closed out FY 2025 with Q4 revenue of US$3.1 billion and basic EPS of US$0.60, alongside trailing 12 month revenue of US$11.8 billion and EPS of US$2.14 that sits against 17.7% earnings growth over the past year. The company has seen quarterly revenue move from US$2.9 billion in Q4 2024 to US$3.1 billion in Q4 2025. Over the same period, basic EPS went from US$0.40 to US$0.60, with earnings growth of 18.8% annualized over five years paired with a net margin of 22.1% compared with 20.7% a year earlier. Taken together, the latest numbers point to firm profitability that gives investors a clear read on how current margins support the growth story.
See our full analysis for Williams Companies.
With the headline results on the table, the next step is to see how these margins and growth rates line up with the dominant stories around Williams Companies, and where the data pushes back on those expectations.
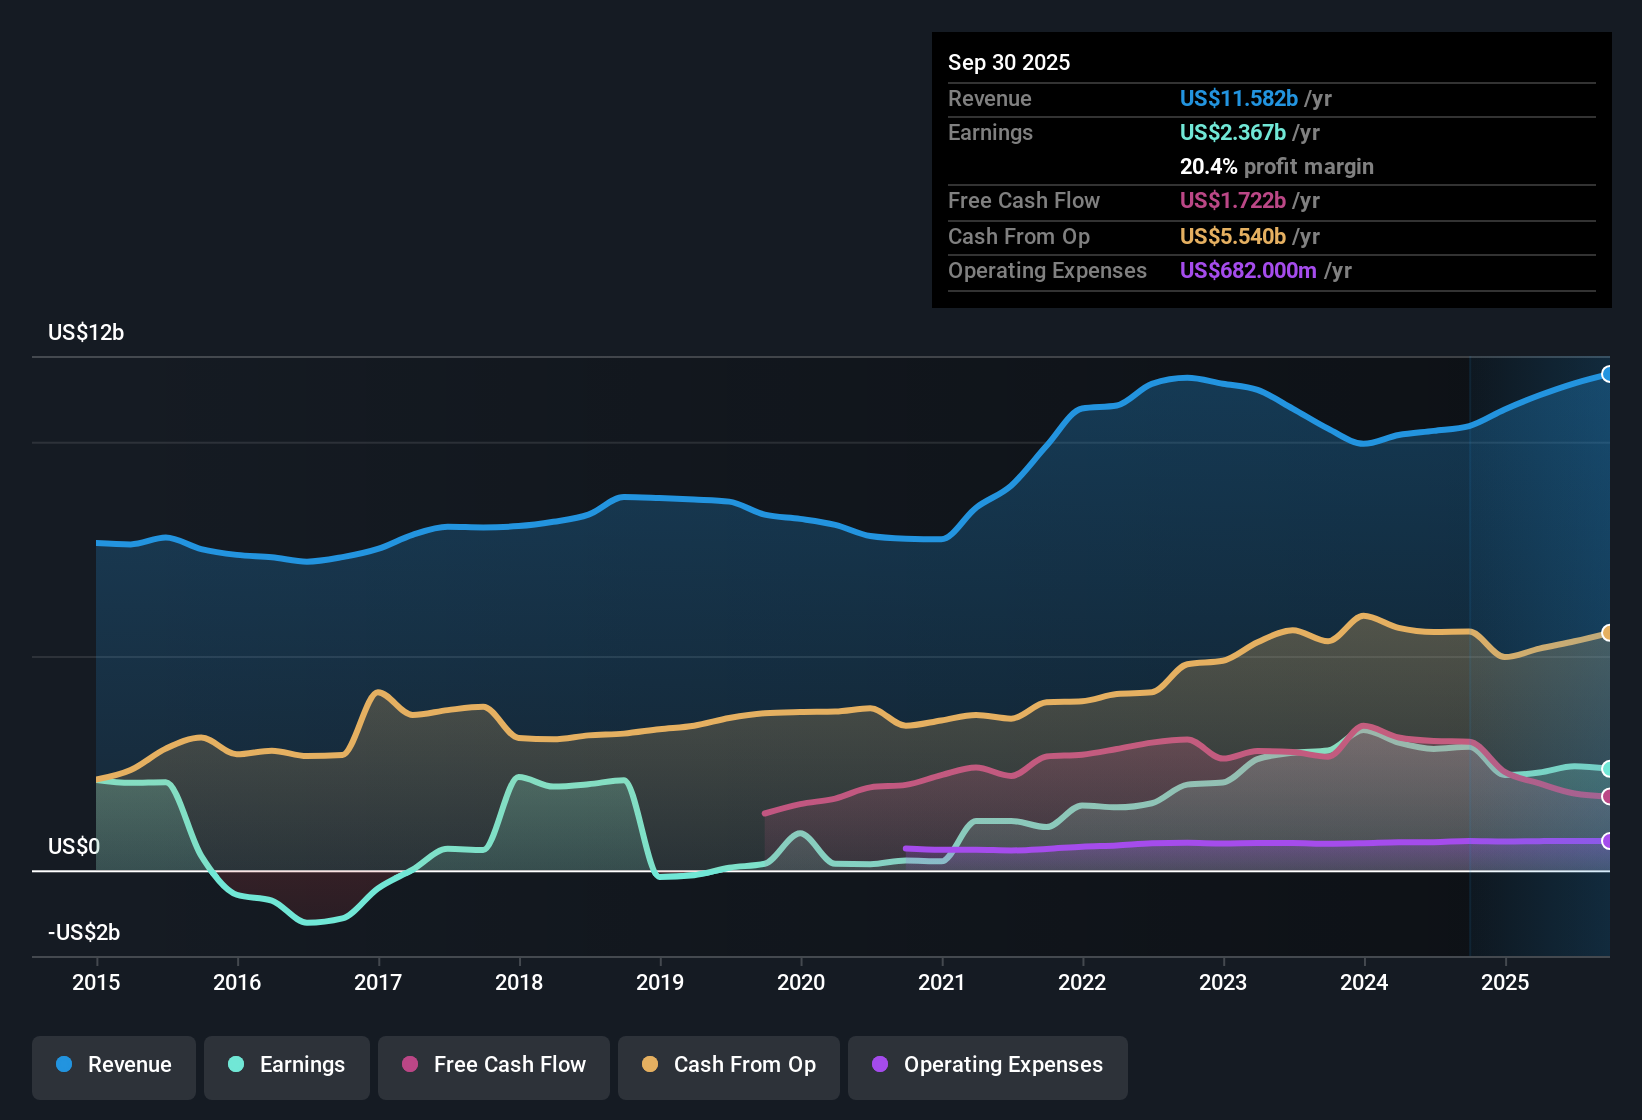
NYSE:WMB Earnings & Revenue History as at Feb 2026
TTM profit margin holds above 22%
Over the last twelve months, Williams generated about US$11.8b in revenue and US$2.6b in net income, which works out to a 22.1% net margin compared with 20.7% a year earlier.
Supporters of the bullish view point to this combination of steady revenue of around US$3.1b in Q4 and TTM EPS of US$2.14 as fitting a story of durable profitability, yet:
Five year annualized earnings growth of 18.8% lines up with the bullish argument that the existing pipeline network and contracted projects have been a solid earnings engine so far.
At the same time, the bullish expectation for rising margins has to be weighed against the fact that net profit margin is currently 22.1%, so any further improvement would be on top of an already fairly high level.
Over the past year of steady margin expansion, bulls argue Williams is behaving more like a cash generative infrastructure utility than a volatile energy play, which is exactly the setup their growth story leans on.
🐂 Williams Companies Bull Case
P/E premium and DCF gap pull in opposite directions
The shares trade at a P/E of 33.2x against peers at 15.5x and the wider US Oil & Gas industry at 14.1x, while the current price of US$71.12 sits below a DCF fair value of about US$96.97, which is roughly 26% higher.
Bears focus on this tension, arguing the rich P/E multiple leaves little room for disappointment even if cash flow based models indicate upside:
The analyst price target of about US$72.58 is only slightly above the current price, which is much closer than the DCF fair value figure, so skeptics question whether the more optimistic cash flow assumptions are realistic.
With earnings up 17.7% over the last year and revenue growth forecasts of about 10.6% a year, critics argue that paying more than double the sector P/E for mid teens growth could be demanding if those growth rates slow.
Skeptics warn that when valuation signals conflict like this, a lot depends on whether Williams keeps delivering similar growth to justify paying such a premium multiple.
🐻 Williams Companies Bear Case
Growth track record vs payout and debt risks
Earnings grew 17.7% over the last twelve months and about 18.8% per year over five years, while the company offers a 2.95% dividend that is flagged as not well covered by earnings or free cash flow and carries a high level of debt.
Consensus style commentary highlights that this mix of solid multi year earnings growth and flagged balance sheet risks creates a trade off for investors:
On one hand, TTM net income of around US$2.6b against revenue of US$11.8b shows the core business has generated meaningful profits that back the growth story many bulls reference.
On the other hand, the dividend coverage concern and high leverage mean part of that profit stream is already spoken for, so investors watching FY 2025 results may pay close attention to how comfortably cash flows keep up with both payouts and debt obligations.
Next Steps
To see how these results tie into long-term growth, risks, and valuation, check out the full range of community narratives for Williams Companies on Simply Wall St. Add the company to your watchlist or portfolio so you'll be alerted when the story evolves.
See the numbers differently? Take a couple of minutes to test your own thesis against the data and shape the story you think matters most, Do it your way.
A great starting point for your Williams Companies research is our analysis highlighting 3 key rewards and 2 important warning signs that could impact your investment decision.
See What Else Is Out There
Williams Companies pairs a rich 33.2x P/E and flagged dividend coverage concerns with high debt, which may leave some investors uneasy about risk and income reliability.
If you are worried about that debt load and payout pressure, take a few minutes to compare it with companies in our solid balance sheet and fundamentals stocks screener (45 results) that prioritize financial strength and resilience.
This article by Simply Wall St is general in nature. We provide commentary based on historical data and analyst forecasts only using an unbiased methodology and our articles are not intended to be financial advice. It does not constitute a recommendation to buy or sell any stock, and does not take account of your objectives, or your financial situation. We aim to bring you long-term focused analysis driven by fundamental data. Note that our analysis may not factor in the latest price-sensitive company announcements or qualitative material. Simply Wall St has no position in any stocks mentioned.