Download
Support العربية
  • Invest
  • Products
  • Pricing
  • Academy
  • Free Stocks Hot
  • Trading
Sahm ID
My Account
Log Out

Chart Pattern Analysis

Learn about chart patterns to enhance your understanding of market analysis and trading techniques.

Catalog

Understanding Double Top and Double Bottom Patterns

What Is Ascending Channel and Descending Channel?

Ascending Triangle & Descending Triangle Chart Pattern Explained

What Are Wedge Patterns?

Getting to Know Flag Patterns

    Chart Pattern Analysis

    Learn about chart patterns to enhance your understanding of market analysis and trading techniques.

    • Understanding Double Top and Double Bottom Patterns
      Understanding Double Top and Double Bottom Patterns

      Understanding Double Top and Double Bottom Patterns

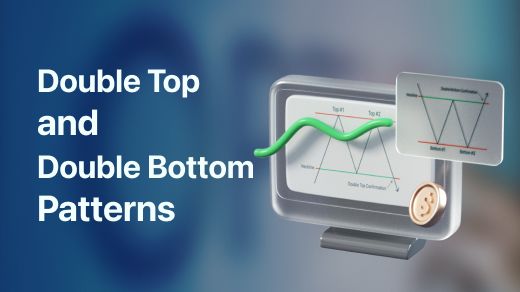
      A double top is a bearish technical reversal pattern that forms after an asset reaches a high price two consecutive times with a moderate decline between the two highs.

      315K
    • What Is Ascending Channel and Descending Channel?
      What Is Ascending Channel and Descending Channel?

      What Is Ascending Channel and Descending Channel?

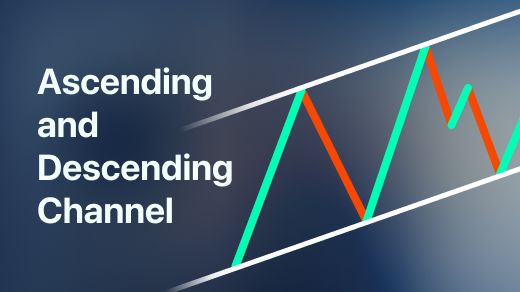
      An ascending channel occurs when analyzing an overall uptrend in the asset price. It is a series of price highs and lows contained between upward-sloping parallel lines.

      316K
    • Ascending Triangle & Descending Triangle Chart Pattern Explained
      Ascending Triangle & Descending Triangle Chart Pattern Explained

      Ascending Triangle & Descending Triangle Chart Pattern Explained

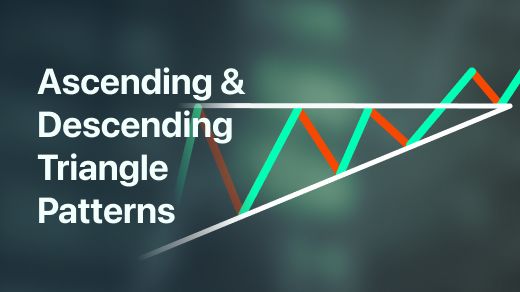
      An ascending triangle is a bullish continuation pattern, and it is created by price moves that allow for a horizontal line to be drawn along the swing highs and a rising trendline to be drawn along th

      212K
    • What Are Wedge Patterns?
      What Are Wedge Patterns?

      What Are Wedge Patterns?

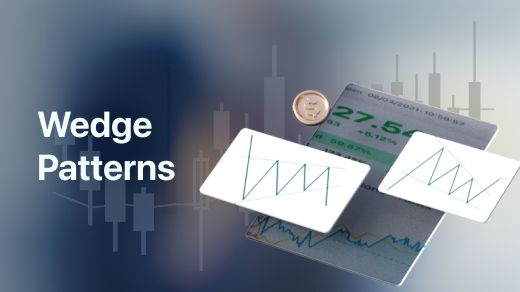
      A wedge is a price pattern marked by converging trend lines on a price chart. The two trend lines are drawn to connect the respective highs and lows of a price series over the periods of time.

      206K
    • Getting to Know Flag Patterns
      Getting to Know Flag Patterns

      Getting to Know Flag Patterns

      A flag is a short-term price pattern used to identify the possible continuation of a previous trend from a point at which price has drifted against that same trend.

      208K

    Make it easy for you

    Invest

    • Stocks
    • ETFs
    • Options
    • Warrants
    • OTC
    • REITs
    • IPOs
    • Margin

    Markets

    • Saudi Market
    • U.S. Market
    • Features

      Smart Selection
    • Analytical Tool
    • Trading Tools
    • Customer Care
    • Sahm AI
    • Account Security and P&L

    Company

    • About Us
    • Organizational Chart
    • Management Team
    • CMA License
    • Support

    Legal & Regulatory

    • Terms & Conditions
    • Disclaimer
    • Personal Data Protection

    Contact Us

    • WhatsApp
    • +966 920007889
    • cs@sahmcapital.com
    • Feedback and Suggestions

    Copyright ©2026 Sahm Capital Financial Company All Rights Reserved

    Licensed Entity Sahm Capital Financial Company

    5/F, 3.05 building, KAFD, Wadi Abrad, Al Aqiq Dist., Riyadh 13519, KSA