10x Genomics (TXG) Stock Valuation Split After Strong Recent Momentum
10x Genomics TXG | 0.00 |
Recent performance snapshot for 10x Genomics
10x Genomics (TXG) has drawn investor interest after a recent upswing in the stock, with returns of 36.0% over the past month and 59.4% over the past 3 months, compared with weaker multi year performance.
At a share price of $28.84, 10x Genomics has seen strong recent momentum, with a 30 day share price return of 36.0% and year to date share price return of 73.5%. This contrasts with a weaker 3 year total shareholder return of 50.4% and 5 year total shareholder return of 85.4%.
If you are comparing 10x Genomics with other high growth healthcare names, this is a good moment to see what else is moving through the 38 healthcare AI stocks.
With the stock up sharply in recent months, yet trading at an estimated 11% discount to one intrinsic value estimate, investors now face a key question: Is there still a buying opportunity here, or is the market already pricing in future growth?
Most Popular Narrative: 43.2% Overvalued
Against the last close of $28.84, the most followed valuation narrative points to a fair value of $20.14, a sizable gap that frames the debate around 10x Genomics today.
Recent and upcoming product launches including Flex v2 (targeting higher throughput, lower costs, and AI integration), Visium HD extensions, and Xenium RNA plus protein are expanding the range of applications and reinforcing 10x''s leadership in advanced genomics tools, expected to drive both top-line growth and sustain premium pricing over time.
Curious what kind of revenue path and margin step up those products would need to support that valuation gap? The narrative leans heavily on measured growth, improving profitability and a future earnings multiple that assumes the market will still pay up for this platform story.
Result: Fair Value of $20.14 (OVERVALUED)
However, weaker recent academic funding and pressure on instrument pricing could still cap revenue progress and delay any move toward consistent profitability.
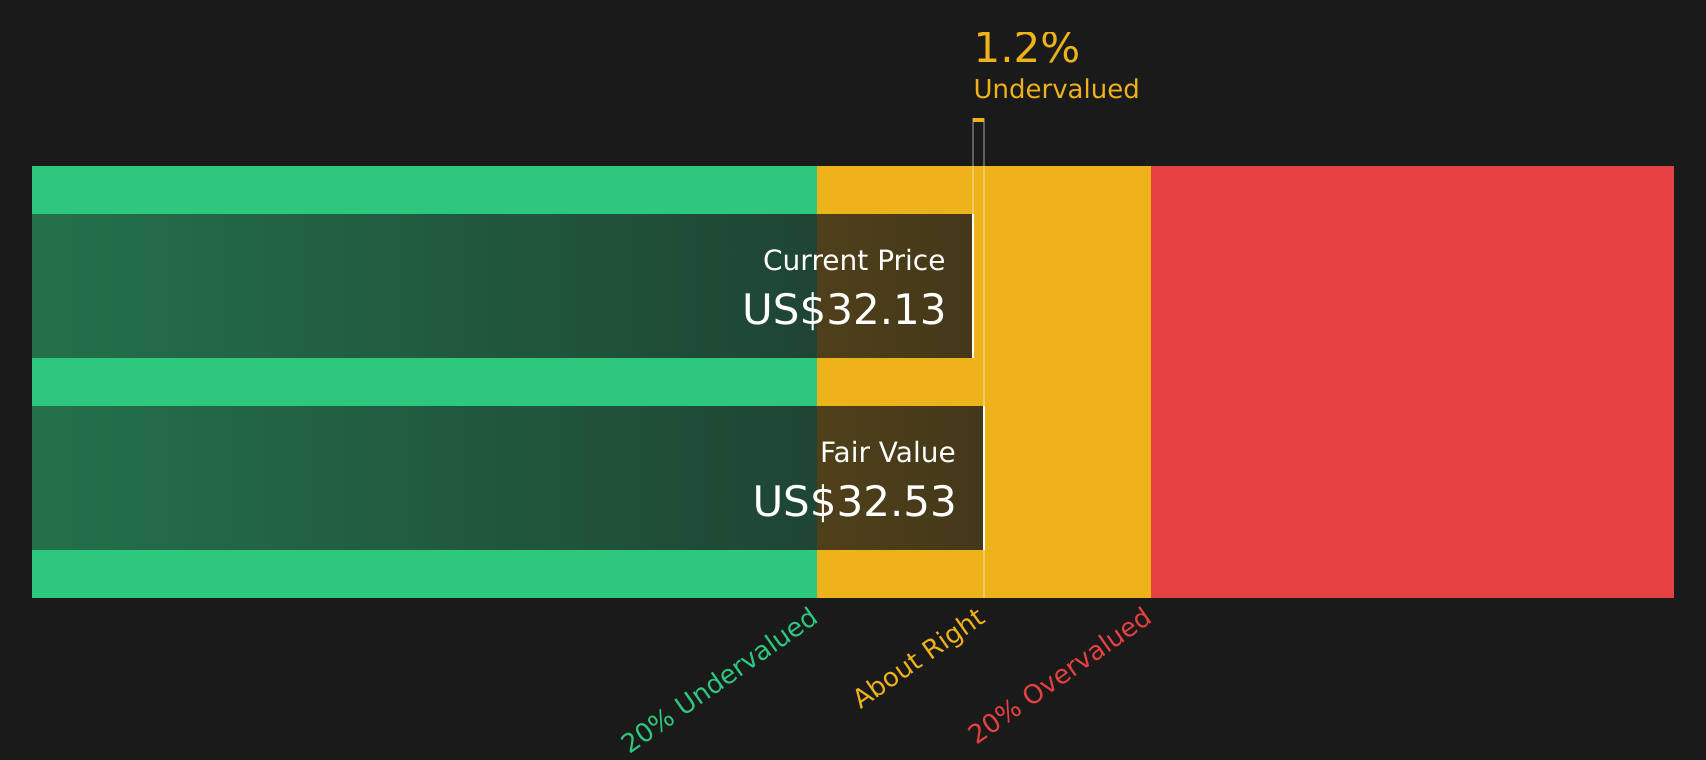
Another View: Cash Flows Paint A Different Picture
While the most popular narrative sees 10x Genomics as 43.2% overvalued at a fair value of $20.14, our DCF model points in the other direction. It indicates a fair value estimate of $32.57, or about 11.5% above the current $28.84 share price.
These two models produce different answers. Which set of assumptions do you find more realistic for revenue, margins and required returns over time?
Simply Wall St performs a discounted cash flow (DCF) on every stock in the world every day (check out 10x Genomics for example). We show the entire calculation in full. You can track the result in your watchlist or portfolio and be alerted when this changes, or use our stock screener to discover 43 high quality undervalued stocks. If you save a screener we even alert you when new companies match - so you never miss a potential opportunity.
Next Steps
With such a split in valuation views, it makes sense to look at the underlying numbers yourself and decide how comfortable you are with the balance of risks and rewards. To see both sides clearly, review the 2 key rewards and 2 important warning signs
Looking for more investment ideas?
If you stop at just one stock, you risk missing stronger balance sheets, better income potential, and lesser known opportunities that could better fit your goals.
- Zero in on resilience by scanning companies in the solid balance sheet and fundamentals stocks screener (48 results) that pair financial strength with underlying fundamentals.
- Target value opportunities by reviewing the 43 high quality undervalued stocks that match quality with prices below one estimate of fair value.
- Spot potential future standouts by checking the screener containing 20 high quality undiscovered gems that the wider market may not be focusing on yet.
This article by Simply Wall St is general in nature. We provide commentary based on historical data and analyst forecasts only using an unbiased methodology and our articles are not intended to be financial advice. It does not constitute a recommendation to buy or sell any stock, and does not take account of your objectives, or your financial situation. We aim to bring you long-term focused analysis driven by fundamental data. Note that our analysis may not factor in the latest price-sensitive company announcements or qualitative material. Simply Wall St has no position in any stocks mentioned.