

1st Source (SRCE) Heads Into July 23 Earnings On A Pricier Than Expected Valuation
1st Source Corporation SRCE | 0.00 |
1st Source (SRCE) heads into its July 23 quarterly earnings report with investor attention centered on how the upcoming results align with recently more cautious analyst expectations for the bank’s earnings outlook.
At a share price of $83.48, 1st Source has logged a 30 day share price return of 9.14% and a year to date share price return of 33.65%, while its 5 year total shareholder return of 123.60% points to stronger long run compounding. This suggests momentum has been building ahead of the July 23 earnings update as investors reassess both growth potential and risk around the bank.
If this kind of move has you thinking about what else might be setting up for the next leg higher, it could be a good time to widen your search with 18 top founder-led companies
The recent run up has left 1st Source trading above the average analyst price target but still at a marked discount to some fair value estimates. This raises the question of whether the market’s caution is now out of line with the valuation numbers.
Preferred P/E of 12.6x: Is It Justified for 1st Source?
On a P/E basis, 1st Source looks slightly expensive at 12.6x earnings compared with its own fair P/E estimate of 11.5x, even though the last close sits well below some cash flow based fair value estimates.
The P/E multiple compares the current share price to earnings per share, which helps you see how much investors are paying for each dollar of profit. For a bank like 1st Source, where earnings and margins matter more than rapid revenue expansion, the P/E ratio is a common way to benchmark expectations around stability, growth, and risk.
Here, the current 12.6x P/E is just above the US Banks industry average of 12.5x and above the estimated fair P/E of 11.5x. That mix suggests the market is pricing 1st Source at a small premium to what the fair ratio implies, and any re rating could move closer to that lower level if expectations cool.
Result: Price-to-earnings of 12.6x (OVERVALUED)
However, 1st Source still faces the risk that earnings on the July 23 update fall short of cautious forecasts, or that loan quality trends unsettle investors.
Another View on 1st Source: Cash Flows Tell a Different Story
While the 12.6x P/E ratio makes 1st Source look a touch expensive next to its 11.5x fair ratio, our DCF model points the other way, with an estimated fair value of $124.68 versus the current $83.48, implying the stock trades at a steep discount on cash flow assumptions.
Two models, two different answers, and both are built on reasonable inputs. Which one do you weigh more heavily when earnings land on July 23?
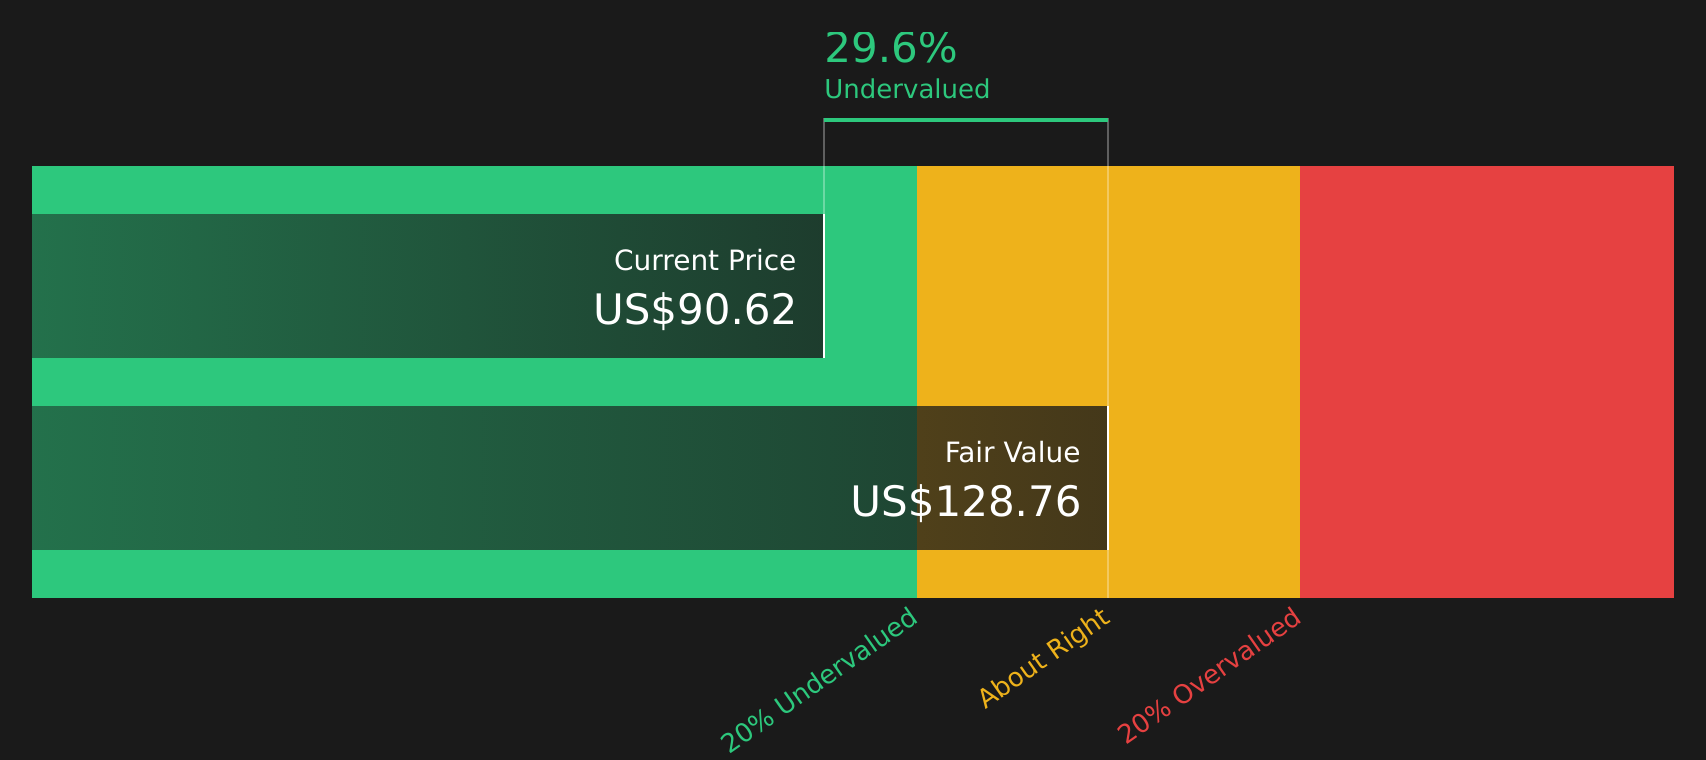
Simply Wall St performs a discounted cash flow (DCF) on every stock in the world every day (check out 1st Source for example). We show the entire calculation in full. You can track the result in your watchlist or portfolio and be alerted when this changes, or use our stock screener to discover 47 high quality undervalued stocks. If you save a screener we even alert you when new companies match - so you never miss a potential opportunity.
Next Steps
With sentiment on 1st Source split between cautious valuation signals and supportive fundamentals, it may be useful to review the underlying data yourself before the story moves further. To see what investors are finding encouraging, take a close look at the 3 key rewards
Looking for more investment ideas beyond 1st Source?
Once you have a view on 1st Source, do not stop there; broaden your opportunity set with focused stock ideas that match the way you like to invest.
- Target companies that look mispriced by screening for 47 high quality undervalued stocks that pair stronger fundamentals with more appealing valuations.
- Build a steadier income stream by focusing on 8 dividend fortresses that aim to combine higher yields with resilient underlying businesses.
- Protect your downside by concentrating on 84 resilient stocks with low risk scores that score well on balance sheet strength and business quality.
This article by Simply Wall St is general in nature. We provide commentary based on historical data and analyst forecasts only using an unbiased methodology and our articles are not intended to be financial advice. It does not constitute a recommendation to buy or sell any stock, and does not take account of your objectives, or your financial situation. We aim to bring you long-term focused analysis driven by fundamental data. Note that our analysis may not factor in the latest price-sensitive company announcements or qualitative material. Simply Wall St has no position in any stocks mentioned.