3 Penny Stocks With Strong Balance Sheets And Profit Margins
Grab Holdings GRAB | 0.00 |
Penny stocks can feel like the wild west, but the Financially Fit Penny Stocks screener filters for companies trading below 5 that still show signs of solid financial health. With inflation trends, central bank signals and mixed global growth keeping investors on their toes, many are looking for smaller stocks where balance sheet discipline matters. This screener focuses on penny stocks that may carry a lower risk profile than more fragile early stage businesses. In this article, you will see 3 stocks from this screener that stand out for further research.
Grab Holdings (GRAB)
Overview: Grab Holdings runs a superapp across Southeast Asia that brings together ride-hailing, food and package delivery, digital payments, and consumer financial services like lending and insurance, all inside one ecosystem. By linking millions of users and merchants across eight countries, Grab aims to become everyday infrastructure for transport, shopping, and money management.
Operations: Grab generates most of its revenue from Deliveries at about US$1.9b and Mobility at about US$1.3b, with Financial Services contributing about US$379m and Other services about US$4m.
Market Cap: US$14.6b
Grab Holdings stands out in the Financially Fit Penny Stocks screener because it combines a large superapp footprint with improving fundamentals, including a net profit margin in the low double digits and revenue guidance in the US$4.04b to US$4.10b range for 2026. Analysts see further earnings growth potential. The stock is flagged as trading at a meaningful discount to estimated fair value, even with a relatively high P/E and strong recent earnings expansion. At the same time, investors need to weigh funding risks, a reliance on external capital, and questions around the sustainability of very strong recent earnings gains. In addition, there are active board refreshes, a US$500m buyback plan, and growing exposure to digital banking in Indonesia. Overall, Grab is a penny stock that rewards closer inspection rather than a quick verdict.
Grab’s expanding superapp footprint and early profitability story raise a bigger question: is the current price really capturing that mix of growth, banking exposure and execution risk highlighted in the DCF valuation analysis for Grab Holdings

Marqeta (MQ)
Overview: Marqeta runs a cloud-based platform that allows companies to issue physical and virtual cards, process transactions, and plug in features like savings accounts, bill pay, and money movement using open APIs. Its tools power use cases such as buy now, pay later, gig economy payouts, expense cards, and embedded finance for banks, fintechs, and e-commerce platforms.
Operations: Marqeta generates about US$651.6m in data processing revenue, with roughly US$551.2m from the United States and about US$100.4m from customers outside the US.
Market Cap: US$1.6b
Marqeta may be relevant if you are looking at how card issuing and embedded finance could change, because its platform sits behind many digital cards, BNPL offerings, and gig worker payouts. It has reported its first GAAP quarterly profit with Q1 2026 net income of US$8m. The company is expanding in Europe through TransactPay and Banking Circle partnerships, and it is also focusing on stablecoin-backed cards and flexible credit credentials that could help it adapt as payment habits shift. At the same time, heavy reliance on a few customers, muted revenue growth, rising costs, insider selling, and a P/S above peers mean investors are currently paying a premium while accepting meaningful execution and funding risk. This makes the next few years of Marqeta’s development important to monitor.
Marqeta’s first GAAP profit suggests that the card issuing story may be just getting started, but the real tension between opportunity and concentration risk shows up clearly in the 1 key reward and 3 important warning signs

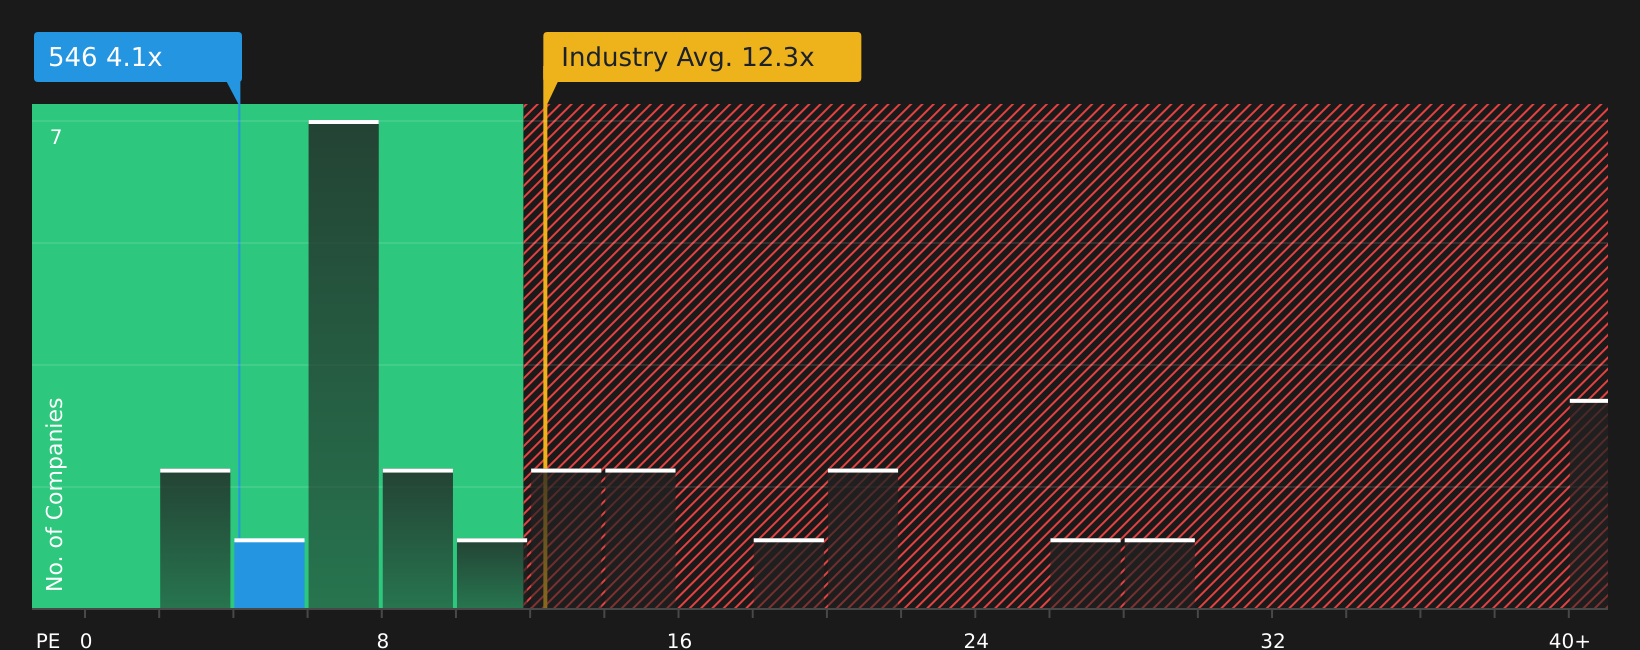
Fufeng Group (SEHK:546)
Overview: Fufeng Group is a China based producer of fermentation driven food additives and biochemical products, supplying ingredients such as monosodium glutamate, starch sweeteners, amino acids and gums to food, feed and industrial customers in China and overseas markets.
Operations: Fufeng Group generates most of its revenue from Food Additives at about CN¥13.4b and Animal Nutrition at about CN¥10.5b, with smaller contributions from High-End Amino Acid (about CN¥2.0b), Colloid (about CN¥1.2b) and Others (about CN¥0.8b), and sells roughly CN¥19.4b in the PRC and CN¥8.5b overseas.
Market Cap: HK$11.4b
Fufeng Group catches the eye in a Financially Fit Penny Stocks context because it mixes low P/E pricing with a long record of earnings growth around 15.2% a year over 5 years and forecast earnings growth of about 9.5% a year. The stock also offers a high 9.23% dividend yield, although free cash flow coverage is thin, which could affect how reliable that income stream is over time. Recent results show revenue of CN¥27,879.19m and net income of CN¥2,465.23m, alongside approval for both ordinary and special dividends. In addition, the Kazakhstan production base adds an expansion angle that could change the earnings profile, but only if execution and capital discipline track in the right direction.
Fufeng Group’s mix of low P/E pricing, high yield and Kazakhstan expansion raises a clear question about how much risk is already baked in, so the 4 key rewards and 1 important warning sign could change how you see the whole story
The three stocks here are only the starting point, as the full Financially Fit Penny Stocks screener surfaced 3,599 more companies with equally compelling financial stories that you have not seen yet, all filtered through the Financially Fit Penny Stocks screener. Use Simply Wall St to identify, analyze, and filter those penny stocks by the exact catalysts and narratives that matter to you, so you can focus on the highest conviction ideas instead of wading through the entire market on your own.
Take Control of Your Investment Journey
If Fufeng Group or any of these companies have caught your attention, register for FREE with Simply Wall St and add your companies to a Watchlist to monitor the share price against the fair value and track any new developments as they happen. Once you've made your move, manage your holdings with our Portfolio Command Center that filters out the noise to deliver only the most critical, actionable updates. Throughout your journey, our Community allows you to filter the best ideas from thousands of investor perspectives. By uncovering hidden catalysts and risks early, you'll accelerate your decision-making and stay one step ahead of the market.
Seeking Fresh Alternatives Before They Fly?
Markets move fast, and the next breakout themes can shift before most investors notice. Tap into curated ideas while they are still under the radar for now, and consider positioning early.
- Identify under-the-radar opportunities by scanning a curated 19 high quality undiscovered gems that show solid fundamentals before wider momentum develops.
- Explore resilient defensives by reviewing a hand picked 65 resilient stocks with low risk scores that aim to keep risk scores contained while the crowd focuses on hotter stories.
- Assess long term infrastructure exposure by reviewing a focused 34 power grid technology and infrastructure stocks positioned around grid upgrades, electrification and energy transition themes.
This article by Simply Wall St is general in nature. We provide commentary based on historical data and analyst forecasts only using an unbiased methodology and our articles are not intended to be financial advice. It does not constitute a recommendation to buy or sell any stock, and does not take account of your objectives, or your financial situation. We aim to bring you long-term focused analysis driven by fundamental data. Note that our analysis may not factor in the latest price-sensitive company announcements or qualitative material. Simply Wall St has no position in any stocks mentioned.