3 Stocks For Inflation Risk And Higher Rates Exposure
CF Industries Holdings, Inc. CF | 0.00 |
Global inflation pressures, higher borrowing costs, and the risk of deeper fallout from Middle East tensions are reshaping where risk and opportunity sit in the stock market. Slower projected growth of 2.5% in 2024 and rising costs for energy, commodities, and debt are putting fresh focus on how different companies are exposed to this news. This article breaks down three stocks from our Global Inflation and Geopolitical Risk Impact Stocks screener. It spotlights one that could benefit from current conditions and two where the same forces may weigh more heavily on the investment case.
Qatar National Bank (CASE:QNBE)
Overview: Qatar National Bank (CASE:QNBE) is a Cairo based subsidiary of Qatar National Bank that provides a wide range of retail and corporate banking services in Egypt, from current and savings accounts to loans, cards, advisory and treasury services across individuals, corporate and other business clients.
Operations: The bank generates its EGP55.5b of revenue in Egypt, primarily from Other Businesses at EGP19.8b, Corporate Banking at EGP15.6b, Individuals at EGP15.4b and Investments at EGP4.7b.
Market Cap: EGP114.4b
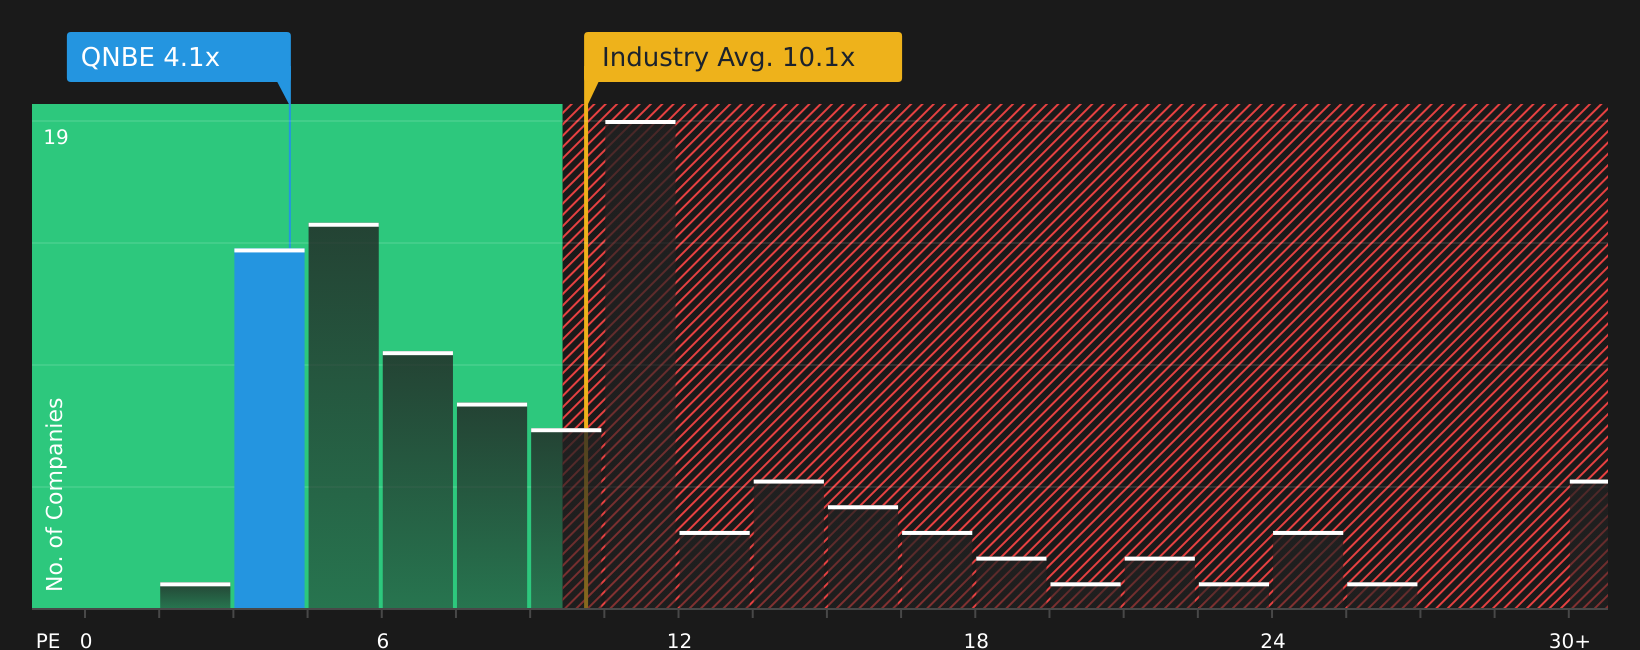
Qatar National Bank may look appealing on the surface with high reported profitability, a low P/E of 4.1x relative to local and regional peers, and earnings and revenue forecasts that analysts expect to grow in the mid teens. However, the risks tied to its context are hard to ignore. A high level of bad loans at 4.5% hints at meaningful credit risk just as growth projections for the wider region are being cut and debt stress in the Middle East is rising. The bank also shows weaker board independence, which can matter when credit conditions tighten. For investors, the combination of strong recent metrics, elevated asset quality risk and a challenging Gulf backdrop makes Qatar National Bank a story that deserves closer scrutiny before taking on exposure.
Qatar National Bank’s low 4.1x P/E and high reported profitability might be masking something investors are not fully pricing in. The real story only comes into focus once you read the 1 warning sign
CF Industries Holdings (CF)
Overview: CF Industries Holdings (NYSE:CF) produces ammonia and nitrogen based fertilizers and industrial products, supplying farmers and industrial customers worldwide with key inputs for crop yields and emissions control. It sells ammonia, granular urea, urea ammonium nitrate, ammonium nitrate and related products to cooperatives, retailers, distributors, traders, and industrial users.
Operations: CF Industries generates its US$7.4b of revenue mainly from Ammonia at US$2.3b, Urea Ammonium Nitrate Solution (UAN) at US$2.3b, Granular Urea at US$1.9b, Other products at US$540m, and Ammonium Nitrate (AN) at US$378m.
Market Cap: US$16.3b
CF Industries sits at the center of the current nitrogen squeeze, with a cost advantage from North American gas, a “tight” global market for products like urea and ammonia, and fertilizer prices that are being pushed higher by Middle East tensions and disrupted exports. That combination has supported strong profitability, buybacks that lift per share metrics, and growing interest in low carbon ammonia projects tied to tax credits and premium pricing. The catch is that heavy reliance on elevated fertilizer prices, government incentives and tight supply could leave investors exposed if new capacity, policy shifts or lower demand in regions like Latin America and Africa take hold. Understanding how durable these conditions are is crucial before leaning too heavily on recent performance.
CF Industries’ tight nitrogen market story and buybacks are only half the picture; the real question is what comes next for margins and cash returns, and the analysis report for CF Industries Holdings hints at a twist investors often miss

Unilever (LSE:ULVR)
Overview: Unilever is a global consumer goods company that sells everyday products such as shampoo, soap, deodorant, household cleaners, and packaged foods under brands like Dove, Hellmann’s, Knorr, Vaseline, and AXE across Asia Pacific, Africa, the Americas, and Europe.
Operations: Unilever generates most of its revenue from Personal Care Business at €13.2b, Beauty & Wellbeing at €12.8b, Foods at €12.9b, and Home Care at €11.6b.
Market Cap: £94.3b
Unilever is often viewed as a steady consumer staple, with a 3.87% dividend yield, high reported ROE and a portfolio that is pivoting toward higher margin beauty and personal care. However, the current backdrop may warrant caution. Slower global growth, higher input and agricultural costs, and pressure on indebted developing markets could affect margins at the same time that Unilever is reshaping its Foods business and relying on moderate price increases in categories where competition and private labels are intense. Debt is significant, funding relies entirely on external borrowing, and the company has refreshed its board quickly, which can introduce execution risk as it pursues large portfolio moves and AI driven efficiency plans. The tension between an apparently comfortable valuation and these less visible pressure points is a key feature of the current Unilever story.
Unilever’s comfortable dividend and beauty pivot might be masking a tougher story around debt, input costs, and execution on big changes, and the Unilever financial health report could highlight pressure points most investors are not factoring in yet

Take Control of Your Investment Journey
If Unilever or any of these companies have caught your attention, register for FREE with Simply Wall St and add your companies to a Watchlist to monitor the share price against the fair value and track any new developments as they happen. Once you've made your move, manage your holdings with our Portfolio Command Center that filters out the noise to deliver only the most critical, actionable updates. Throughout your journey, our Community allows you to filter the best ideas from thousands of investor perspectives. By uncovering hidden catalysts and risks early, you'll accelerate your decision-making and stay one step ahead of the market.
Seeking Fresh Alternatives Before Others?
Markets move fast and the stocks with real breakout potential rarely stay under the radar for long. Scan these fresh ideas before momentum is fully priced in and consider acting while they are still emerging.
- Spot early trend shifts across cash rich companies by running the list of solid balance sheet and fundamentals (414 results) to see which stocks could hold up when conditions get tougher.
- Explore potential structural demand in critical materials by using the 29 best rare earth metal stocks to pinpoint producers that might benefit if supply stays tight and prices gain momentum.
- Prepare for possible capital rotations into steady income by checking the 493 dividend fortresses and filtering for yields that could stand out if rates start dropping.
This article by Simply Wall St is general in nature. We provide commentary based on historical data and analyst forecasts only using an unbiased methodology and our articles are not intended to be financial advice. It does not constitute a recommendation to buy or sell any stock, and does not take account of your objectives, or your financial situation. We aim to bring you long-term focused analysis driven by fundamental data. Note that our analysis may not factor in the latest price-sensitive company announcements or qualitative material. Simply Wall St has no position in any stocks mentioned.