3 Under The Radar Stocks With High ROE And Low P E Ratios
Oceaneering International, Inc. OII | 0.00 |
With inflation trends diverging across regions and central banks signaling different paths for interest rates, many investors are looking beyond the usual large caps and benchmark heavyweights. That is where the High-Quality Undiscovered Gems screener comes in, focusing on smaller companies with solid fundamentals that are still largely overlooked by big funds. By concentrating on this under-researched corner of the market during a period of mixed growth signals, uneven consumer demand and energy price uncertainty, the screener aims to highlight stocks that may be mispriced or underappreciated. This article discusses three notable stocks from that list.
Oceaneering International (OII)
Overview: Oceaneering International provides specialized engineered services and robotic solutions for offshore energy, as well as mission-critical work in defense, aerospace, manufacturing, and related industries across the US and multiple international markets. Its operations span subsea robots, subsea hardware, offshore project services, asset integrity software, and aerospace and defense engineering.
Operations: Oceaneering generates most of its revenue from energy-focused segments, led by Energy Subsea Robotics at about US$863.5m, Energy Offshore Projects Group at US$586.5m, Energy Manufactured Products at US$577.6m, and Energy Integrity Management & Digital Solutions at US$280.5m, with an additional US$494.0m from Aerospace and Defense Technologies across the United States, the United Kingdom, Norway, Brazil, Africa, Asia and Australia, and other regions.
Market Cap: US$3.9b
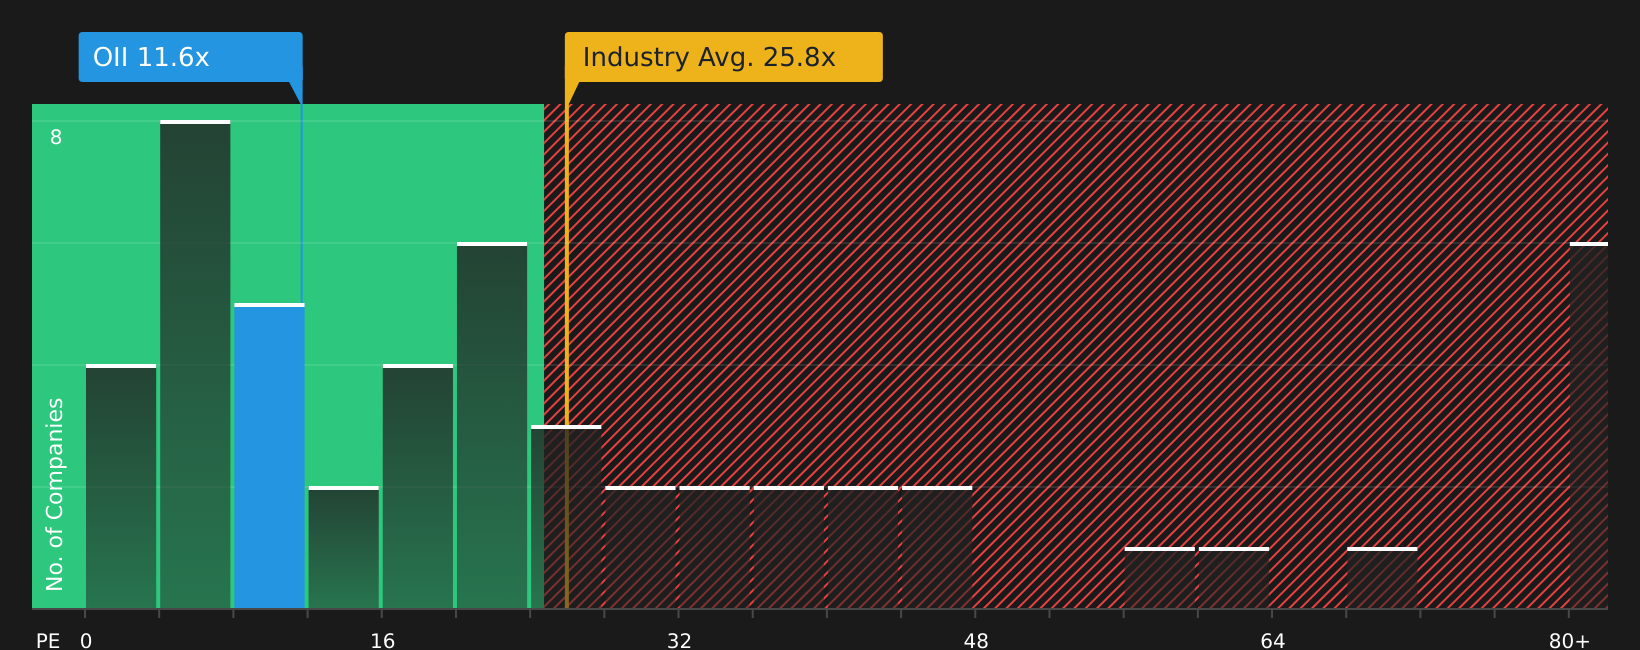
Oceaneering International catches the eye because it sits at the intersection of offshore energy and high-spec robotics, with a high 30.5% ROE and a P/E below both the US market and the Energy Services industry. At the same time, analysts see earnings declining sharply in coming years and margins potentially compressing, while the business still leans heavily on cyclical offshore spending and is exposed to the long-term shift toward renewables. Offsetting that, the growing aerospace and defense work, recurring integrity and decommissioning services, and strong subsea robotics position could help smooth out the cycle and support cash generation. Add in recent index inclusion and active balance sheet moves, and the full risk reward picture is more nuanced than the headline numbers suggest.
Oceaneering International’s mix of a high 30.5% ROE, lower P/E and cyclical offshore exposure raises a clear question about whether the risk reward is being priced correctly. The 2 key rewards and 2 important warning signs (1 is major!) could highlight the twist investors are missing.
Universal Insurance Holdings (UVE)
Overview: Universal Insurance Holdings is a US based integrated residential insurer that offers homeowners, renters, condo, and related property and liability policies, while also handling its own underwriting, claims management, actuarial work, and reinsurance arrangements through both agents and direct online channels.
Operations: Universal Insurance Holdings generates all of its US$1.6b in revenue from property and casualty insurance in the United States.
Market Cap: US$1.2b
Universal Insurance Holdings stands out in the High Quality Undiscovered Gems screener because it combines high recent earnings momentum and a 33.5% ROE with a low P/E multiple and a dividend, while also buying back shares and investing in data driven underwriting. At the same time, you are dealing with real risks, including Florida focused weather exposure, pressure on loss and expense ratios, reliance on reasonably priced reinsurance, and a higher cost debt structure after issuing 7.75% notes due 2031. The interesting question is how this mix of strong profitability, geographic diversification outside Florida, and tighter capital management stacks up against those headwinds, and what that might imply for longer term value.
Universal Insurance Holdings has accelerating profitability and buybacks sitting beside weather and reinsurance risks, so the real question is what the 4 key rewards and 2 important warning signs (1 is major!) reveals about how that balance could shift next

HCI Group (HCI)
Overview: HCI Group is a Tampa based property and casualty insurer that combines a homeowners insurance franchise with its own insurance software platforms, claims processing services, reciprocal exchange operations, and a small real estate portfolio in the United States.
Operations: HCI Group generates most of its revenue from Insurance Operations at about US$841.8m, alongside Exzeo at US$226.5m, Reciprocal Exchange Operations at US$81.3m, Real Estate at US$16.2m, Corporate and other activities at US$24.8m, and reclassifications of US$263.1m.
Market Cap: US$2.3b
HCI Group catches attention because it blends a 28.1% ROE, high quality earnings and record recent premiums with a growing technology platform in Exzeo that is already embedded in its underwriting and claims engine. The company is using that tech edge to keep loss ratios and expenses in check, while returning cash through dividends and recent share buybacks that retired just over 2% of the stock. At the same time, heavy Florida exposure, reliance on Citizens policy takeouts and uncertainty around a potential Exzeo IPO and rising reinsurance costs mean the story is not risk free. The real interest lies in how that mix of strong profitability, technology, capital returns and concentration risk fits together. The 3 key rewards and 1 important major warning sign helps unpack this in detail.
HCI Group’s mix of high quality earnings, Exzeo technology and concentrated Florida exposure leaves a big question hanging over what really drives its valuation. The 3 key rewards and 1 important major warning sign could surface the hidden swing factor investors are missing

The three stocks covered here are just a sample of what this idea is picking up, with the full High-Quality Undiscovered Gems screener surfacing 16 more companies that pair solid fundamentals with equally compelling narratives that have not yet drawn heavy institutional attention. Unlock the rest of the opportunity set by using Simply Wall St to identify, filter and analyze the specific catalysts and storylines that matter most to you so you can focus on the highest conviction ideas.
Take Control of Your Investment Journey
If HCI Group or any of these companies have caught your attention, register for FREE with Simply Wall St and add your companies to a Watchlist to monitor the share price against the fair value and track any new developments as they happen. Once you've made your move, manage your holdings with our Portfolio Command Center that filters out the noise to deliver only the most critical, actionable updates. Throughout your journey, our Community allows you to filter the best ideas from thousands of investor perspectives. By uncovering hidden catalysts and risks early, you'll accelerate your decision-making and stay one step ahead of the market.
Seeking Fresh Alternatives Before They Fly?
New breakout ideas can attract attention quickly. By the time momentum shows up in headlines, the most attractive entry points may already be fading. Review these fresh picks while it matters and consider how they fit your approach.
- Explore companies with cash rich balance sheets by running the list of solid balance sheet and fundamentals (48 results) before they move off the radar.
- Look for dependable income streams by scanning the 10 dividend fortresses and see which high yield payers appear supported by underlying cash flows.
- Evaluate structural demand for critical materials by checking the curated 8 top copper producer stocks and assessing which producers align best with your risk tolerance.
This article by Simply Wall St is general in nature. We provide commentary based on historical data and analyst forecasts only using an unbiased methodology and our articles are not intended to be financial advice. It does not constitute a recommendation to buy or sell any stock, and does not take account of your objectives, or your financial situation. We aim to bring you long-term focused analysis driven by fundamental data. Note that our analysis may not factor in the latest price-sensitive company announcements or qualitative material. Simply Wall St has no position in any stocks mentioned.